29
/
en
AIzaSyAYiBZKx7MnpbEhh9jyipgxe19OcubqV5w
April 1, 2024
51272
Middle income
MIC
false
2
1
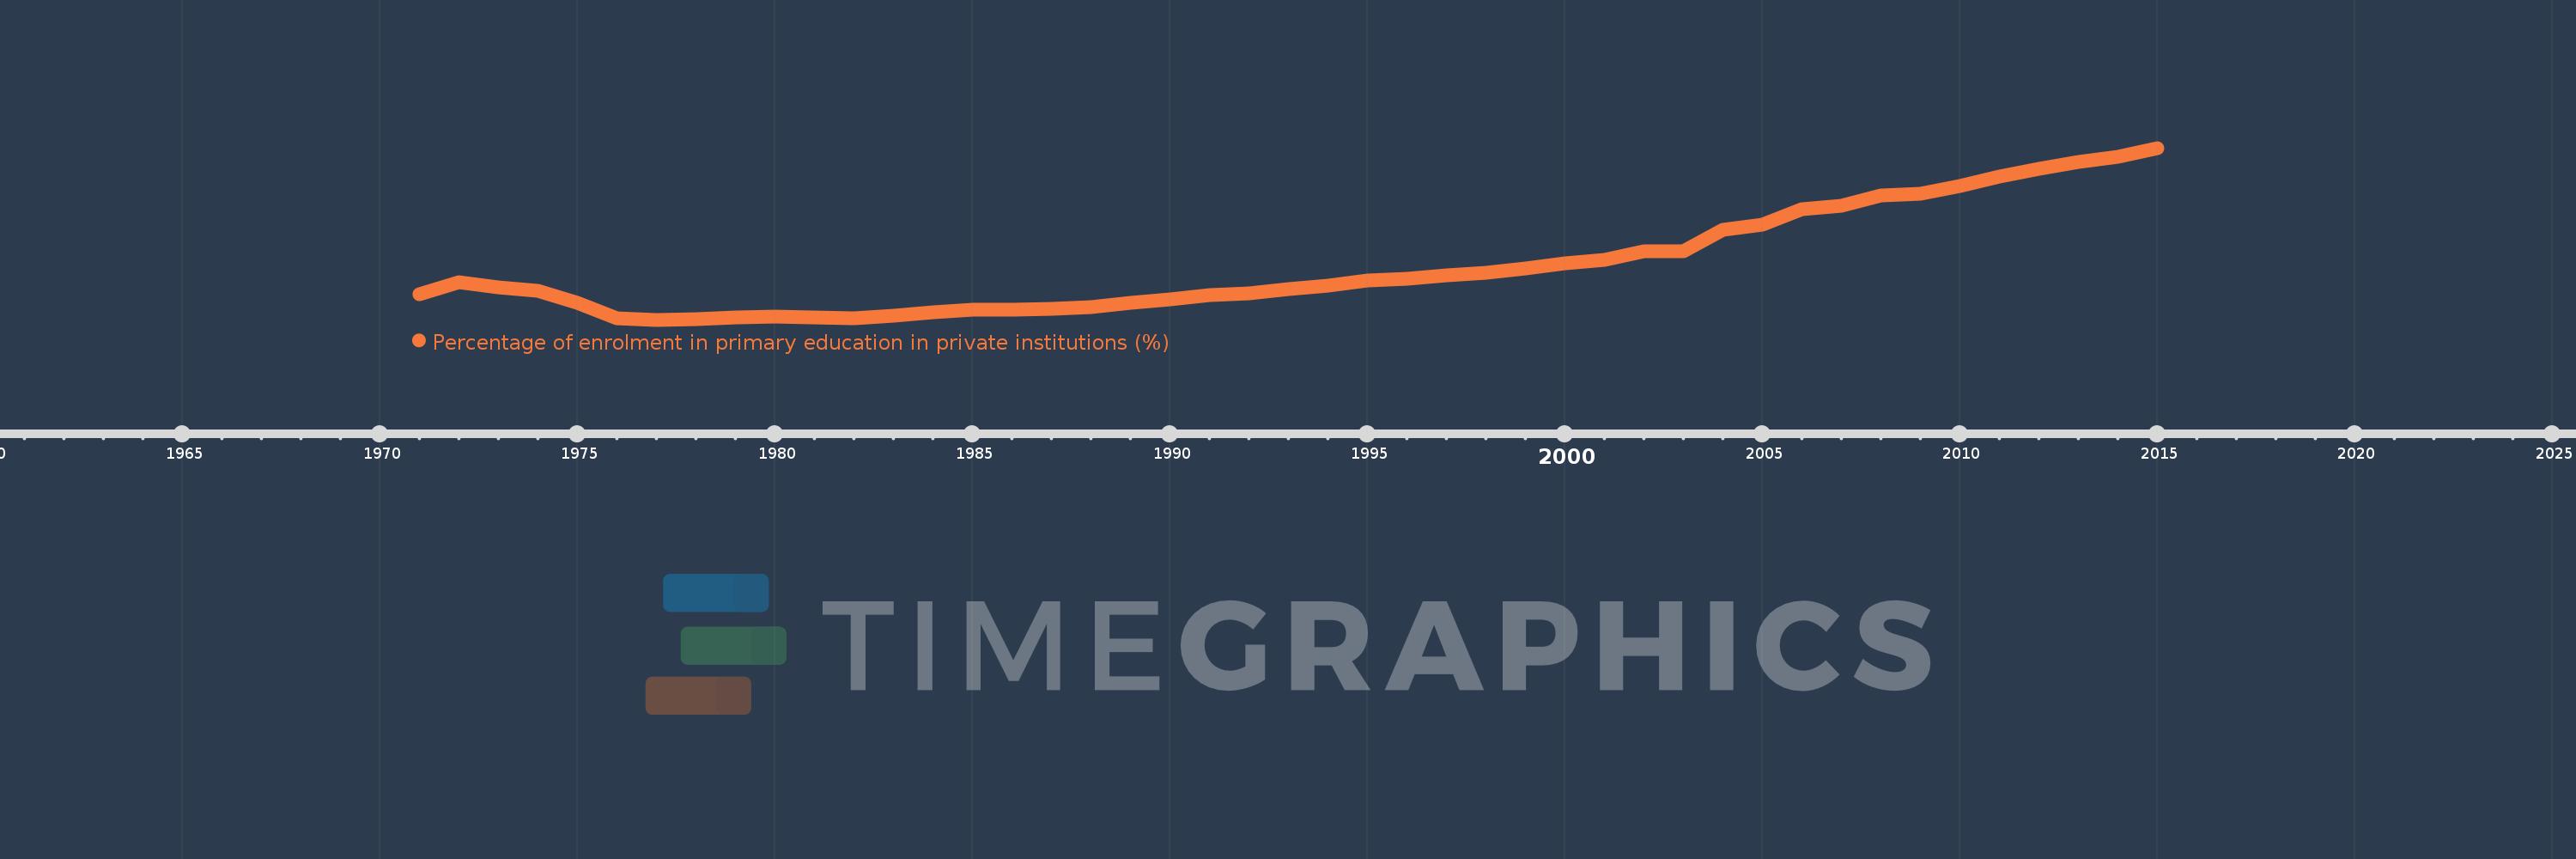
Percentage of enrolment in primary education in private institutions (%)
2015,2014,2013,2012,2011,2010,2009,2008,2007,2006,2005,2004,2003,2002,2001,2000,1999,1998,1997,1996,1995,1994,1993,1992,1991,1990,1989,1988,1987,1986,1985,1984,1983,1982,1981,1980,1979,1978,1977,1976,1975,1974,1973,1972,1971
This statistics in other country:
AfghanistanAlbaniaAlgeriaAndorraAngolaAntigua and BarbudaArab WorldArgentinaArmeniaArubaAustraliaAustriaAzerbaijanBahamas, TheBahrainBangladeshBarbadosBelarusBelgiumBelizeBeninBermudaBhutanBoliviaBosnia and HerzegovinaBotswanaBrazilBritish Virgin IslandsBrunei DarussalamBulgariaBurkina FasoBurundiCabo VerdeCambodiaCameroonCanadaCaribbean small statesCayman IslandsCentral African RepublicCentral Europe and the BalticsChadChileChinaColombiaComorosCongo, Dem. Rep.Congo, Rep.Costa RicaCote d'IvoireCroatiaCubaCuracaoCyprusCzech RepublicDenmarkDjiboutiDominicaDominican RepublicEarly-demographic dividendEast Asia & PacificEast Asia & Pacific (excluding high income)East Asia & Pacific (IDA & IBRD countries)EcuadorEgypt, Arab Rep.El SalvadorEquatorial GuineaEritreaEstoniaEthiopiaEuro areaEurope & Central AsiaEurope & Central Asia (excluding high income)Europe & Central Asia (IDA & IBRD countries)European UnionFijiFinlandFragile and conflict affected situationsFranceGabonGambia, TheGeorgiaGermanyGhanaGibraltarGreeceGrenadaGuatemalaGuineaGuinea-BissauGuyanaHaitiHeavily indebted poor countries (HIPC)High incomeHondurasHong Kong SAR, ChinaHungaryIBRD onlyIcelandIDA & IBRD totalIDA blendIDA onlyIDA totalIndiaIndonesiaIran, Islamic Rep.IraqIrelandIsraelItalyJamaicaJapanJordanKazakhstanKenyaKiribatiKorea, Rep.KuwaitKyrgyz RepublicLao PDRLate-demographic dividendLatin America & Caribbean Latin America & Caribbean (excluding high income)Latin America & the Caribbean (IDA & IBRD countries)LatviaLeast developed countries: UN classificationLebanonLesothoLiberiaLibyaLiechtensteinLithuaniaLow & middle incomeLow incomeLower middle incomeLuxembourgMacao SAR, ChinaMacedonia, FYRMadagascarMalawiMalaysiaMaldivesMaliMaltaMarshall IslandsMauritaniaMauritiusMexicoMiddle East & North AfricaMiddle East & North Africa (excluding high income)Middle East & North Africa (IDA & IBRD countries)Middle incomeMoldovaMonacoMongoliaMoroccoMozambiqueMyanmarNamibiaNauruNepalNetherlandsNew ZealandNicaraguaNigerNigeriaNorth AmericaNorwayOECD membersOmanOther small statesPacific island small statesPakistanPalauPanamaPapua New GuineaParaguayPeruPhilippinesPolandPortugalPost-demographic dividendPre-demographic dividendPuerto RicoQatarRomaniaRussian FederationRwandaSamoaSan MarinoSao Tome and PrincipeSaudi ArabiaSenegalSerbiaSeychellesSierra LeoneSingaporeSlovak RepublicSloveniaSmall statesSolomon IslandsSomaliaSouth AfricaSouth AsiaSouth Asia (IDA & IBRD)SpainSri LankaSt. Kitts and NevisSt. LuciaSt. Vincent and the GrenadinesSub-Saharan Africa Sub-Saharan Africa (excluding high income)Sub-Saharan Africa (IDA & IBRD countries)SudanSurinameSwazilandSwedenSwitzerlandSyrian Arab RepublicTajikistanTanzaniaThailandTimor-LesteTogoTongaTrinidad and TobagoTunisiaTurkeyTurks and Caicos IslandsTuvaluUgandaUkraineUnited Arab EmiratesUnited KingdomUnited StatesUpper middle incomeUruguayVanuatuVenezuela, RBVietnamWest Bank and GazaWorldYemen, Rep.ZambiaZimbabwe Timeline:
This timeline shows a graph from 1971 to 2015 of Middle income. No data until 1970. Number of actual observations by date: 45.
Source name:
World Development Indicators
Source organization:
UNESCO Institute for Statistics
Categories, topics:
Education
Last updated:
apr 23, 2017
Indicators value changes by year
Maximum:
13.649
jan 1, 2015
At the date of observation
Value
Absolute change
Change from previous value
jan 1, 1971
8.397
+8.397
0.0%
jan 1, 1972
8.842
+0.445
5.3%
jan 1, 1973
8.659
-0.183
-2.07%
jan 1, 1974
8.535
-0.124
-1.43%
jan 1, 1975
8.089
-0.446
-5.23%
jan 1, 1976
7.548
-0.541
-6.69%
jan 1, 1977
7.483
-0.064
-0.85%
jan 1, 1978
7.507
+0.024
0.32%
jan 1, 1979
7.577
+0.07
0.94%
jan 1, 1980
7.595
+0.018
0.23%
jan 1, 1981
7.56
-0.035
-0.46%
jan 1, 1982
7.549
-0.011
-0.15%
jan 1, 1983
7.636
+0.087
1.15%
jan 1, 1984
7.744
+0.108
1.41%
jan 1, 1985
7.84
+0.097
1.25%
jan 1, 1986
7.849
+0.009
0.11%
jan 1, 1987
7.883
+0.034
0.44%
jan 1, 1988
7.928
+0.045
0.57%
jan 1, 1989
8.092
+0.164
2.07%
jan 1, 1990
8.22
+0.127
1.57%
jan 1, 1991
8.355
+0.135
1.65%
jan 1, 1992
8.427
+0.072
0.86%
jan 1, 1993
8.571
+0.145
1.72%
jan 1, 1994
8.719
+0.148
1.72%
jan 1, 1995
8.882
+0.163
1.87%
jan 1, 1996
8.959
+0.077
0.86%
jan 1, 1997
9.072
+0.113
1.26%
jan 1, 1998
9.183
+0.111
1.22%
jan 1, 1999
9.31
+0.127
1.38%
jan 1, 2000
9.505
+0.195
2.09%
jan 1, 2001
9.63
+0.124
1.31%
jan 1, 2002
9.941
+0.311
3.23%
jan 1, 2003
9.954
+0.013
0.14%
jan 1, 2004
10.715
+0.761
7.65%
jan 1, 2005
10.909
+0.193
1.8%
jan 1, 2006
11.438
+0.529
4.85%
jan 1, 2007
11.586
+0.149
1.3%
jan 1, 2008
11.934
+0.348
3.0%
jan 1, 2009
12.009
+0.075
0.63%
jan 1, 2010
12.296
+0.287
2.39%
jan 1, 2011
12.616
+0.32
2.6%
jan 1, 2012
12.898
+0.282
2.24%
jan 1, 2013
13.133
+0.235
1.82%
jan 1, 2014
13.332
+0.199
1.52%
jan 1, 2015
13.649
+0.317
2.38%
Ranking of countries by current statistics by years


Comments: