29
/
en
AIzaSyAYiBZKx7MnpbEhh9jyipgxe19OcubqV5w
April 1, 2024
268453
Tunisia
TUN
true
2
1
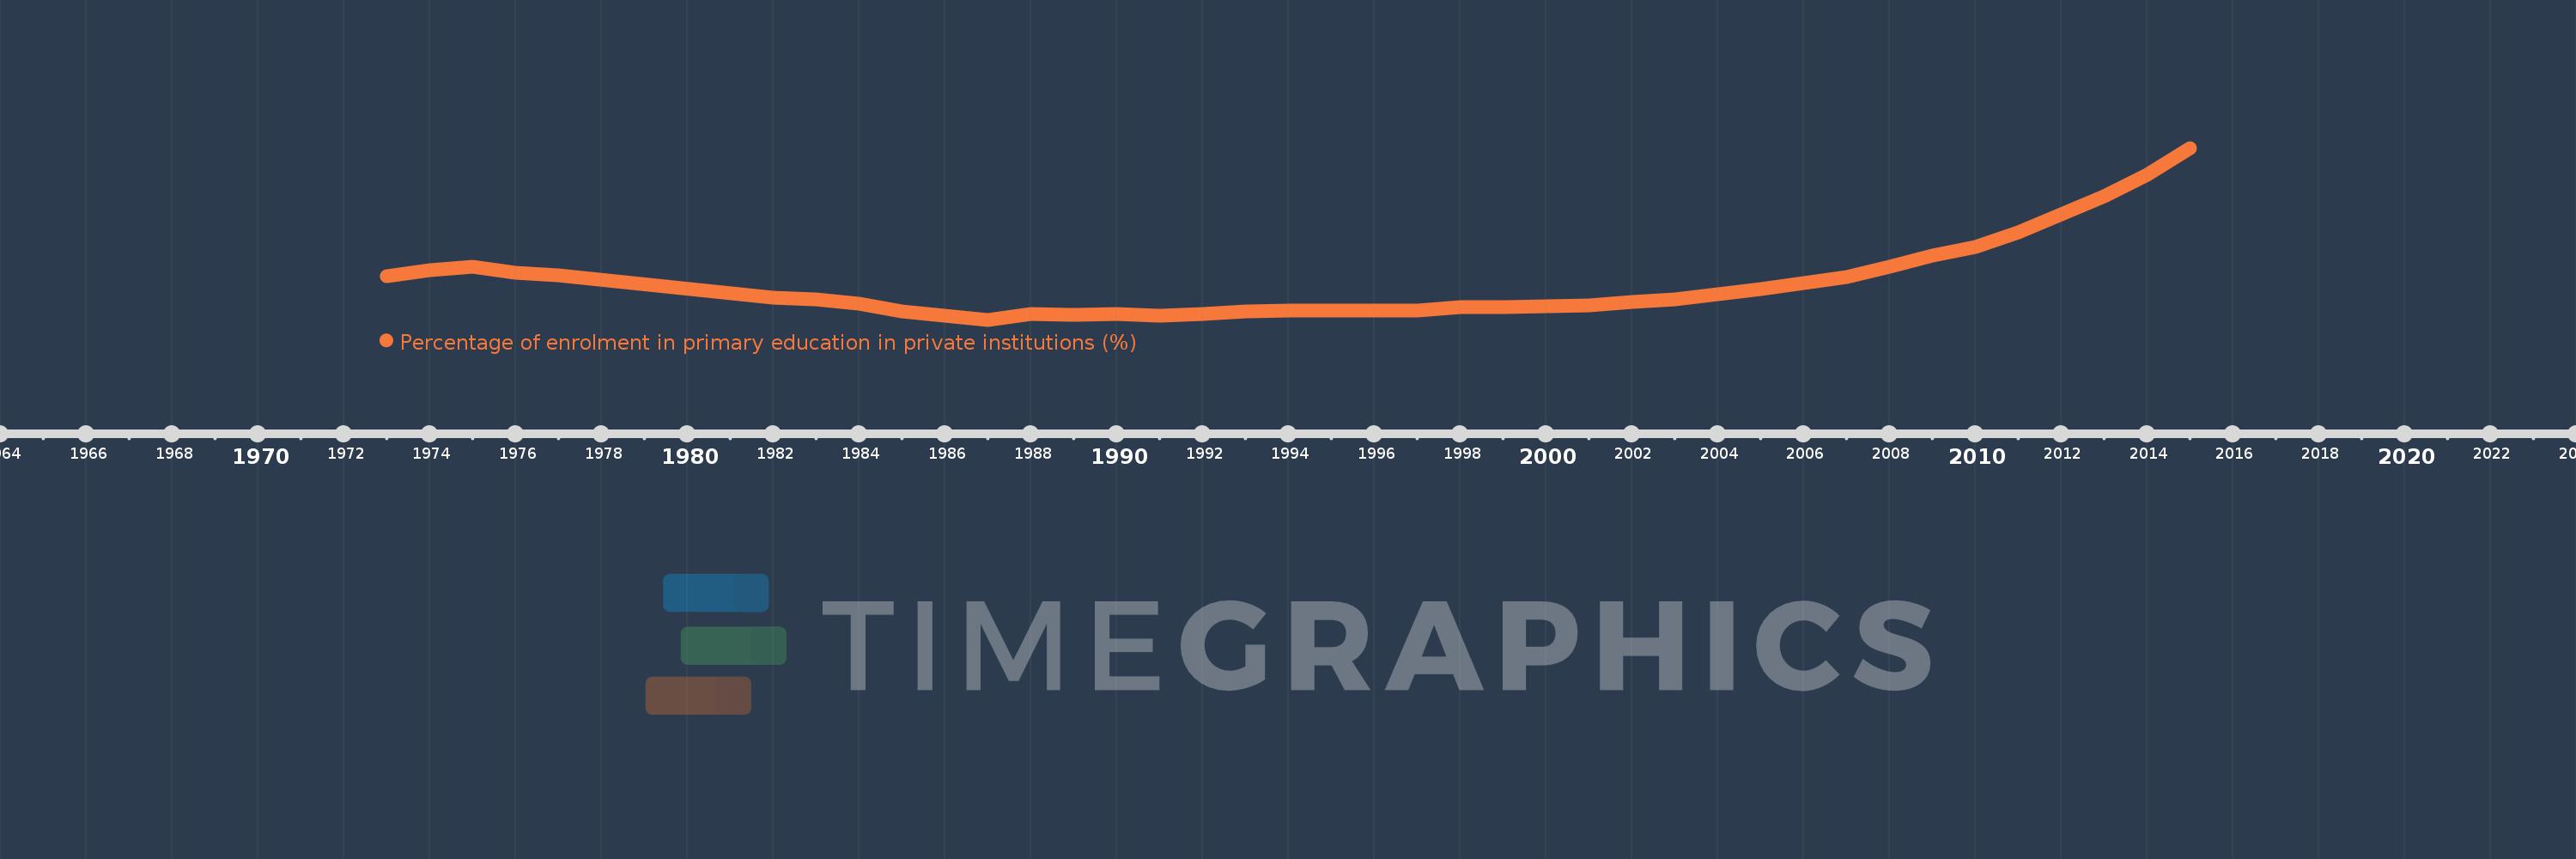
Percentage of enrolment in primary education in private institutions (%)
2015,2014,2013,2012,2011,2010,2009,2008,2007,2006,2005,2004,2003,2002,2001,2000,1999,1998,1997,1996,1995,1994,1993,1992,1991,1990,1989,1988,1987,1986,1985,1984,1983,1982,1977,1976,1975,1974,1973
This statistics in other country:
AfghanistanAlbaniaAlgeriaAndorraAngolaAntigua and BarbudaArab WorldArgentinaArmeniaArubaAustraliaAustriaAzerbaijanBahamas, TheBahrainBangladeshBarbadosBelarusBelgiumBelizeBeninBermudaBhutanBoliviaBosnia and HerzegovinaBotswanaBrazilBritish Virgin IslandsBrunei DarussalamBulgariaBurkina FasoBurundiCabo VerdeCambodiaCameroonCanadaCaribbean small statesCayman IslandsCentral African RepublicCentral Europe and the BalticsChadChileChinaColombiaComorosCongo, Dem. Rep.Congo, Rep.Costa RicaCote d'IvoireCroatiaCubaCuracaoCyprusCzech RepublicDenmarkDjiboutiDominicaDominican RepublicEarly-demographic dividendEast Asia & PacificEast Asia & Pacific (excluding high income)East Asia & Pacific (IDA & IBRD countries)EcuadorEgypt, Arab Rep.El SalvadorEquatorial GuineaEritreaEstoniaEthiopiaEuro areaEurope & Central AsiaEurope & Central Asia (excluding high income)Europe & Central Asia (IDA & IBRD countries)European UnionFijiFinlandFragile and conflict affected situationsFranceGabonGambia, TheGeorgiaGermanyGhanaGibraltarGreeceGrenadaGuatemalaGuineaGuinea-BissauGuyanaHaitiHeavily indebted poor countries (HIPC)High incomeHondurasHong Kong SAR, ChinaHungaryIBRD onlyIcelandIDA & IBRD totalIDA blendIDA onlyIDA totalIndiaIndonesiaIran, Islamic Rep.IraqIrelandIsraelItalyJamaicaJapanJordanKazakhstanKenyaKiribatiKorea, Rep.KuwaitKyrgyz RepublicLao PDRLate-demographic dividendLatin America & Caribbean Latin America & Caribbean (excluding high income)Latin America & the Caribbean (IDA & IBRD countries)LatviaLeast developed countries: UN classificationLebanonLesothoLiberiaLibyaLiechtensteinLithuaniaLow & middle incomeLow incomeLower middle incomeLuxembourgMacao SAR, ChinaMacedonia, FYRMadagascarMalawiMalaysiaMaldivesMaliMaltaMarshall IslandsMauritaniaMauritiusMexicoMiddle East & North AfricaMiddle East & North Africa (excluding high income)Middle East & North Africa (IDA & IBRD countries)Middle incomeMoldovaMonacoMongoliaMoroccoMozambiqueMyanmarNamibiaNauruNepalNetherlandsNew ZealandNicaraguaNigerNigeriaNorth AmericaNorwayOECD membersOmanOther small statesPacific island small statesPakistanPalauPanamaPapua New GuineaParaguayPeruPhilippinesPolandPortugalPost-demographic dividendPre-demographic dividendPuerto RicoQatarRomaniaRussian FederationRwandaSamoaSan MarinoSao Tome and PrincipeSaudi ArabiaSenegalSerbiaSeychellesSierra LeoneSingaporeSlovak RepublicSloveniaSmall statesSolomon IslandsSomaliaSouth AfricaSouth AsiaSouth Asia (IDA & IBRD)SpainSri LankaSt. Kitts and NevisSt. LuciaSt. Vincent and the GrenadinesSub-Saharan Africa Sub-Saharan Africa (excluding high income)Sub-Saharan Africa (IDA & IBRD countries)SudanSurinameSwazilandSwedenSwitzerlandSyrian Arab RepublicTajikistanTanzaniaThailandTimor-LesteTogoTongaTrinidad and TobagoTunisiaTurkeyTurks and Caicos IslandsTuvaluUgandaUkraineUnited Arab EmiratesUnited KingdomUnited StatesUpper middle incomeUruguayVanuatuVenezuela, RBVietnamWest Bank and GazaWorldYemen, Rep.ZambiaZimbabwe Timeline:
This timeline shows a graph from 1973 to 2015 of Tunisia. No data until 1972. Number of actual observations by date: 39.
Source name:
World Development Indicators
Source organization:
UNESCO Institute for Statistics
Categories, topics:
Education
Last updated:
apr 23, 2017
Indicators value changes by year
At the date of observation
Value
Absolute change
Change from previous value
jan 1, 1973
1.255
+1.255
0.0%
jan 1, 1974
1.369
+0.114
9.05%
jan 1, 1975
1.427
+0.058
4.22%
jan 1, 1976
1.325
-0.101
-7.1%
jan 1, 1977
1.272
-0.054
-4.04%
jan 1, 1982
0.855
-0.416
-32.74%
jan 1, 1983
0.815
-0.04
-4.72%
jan 1, 1984
0.74
-0.075
-9.14%
jan 1, 1985
0.587
-0.153
-20.68%
jan 1, 1986
0.505
-0.082
-13.94%
jan 1, 1987
0.434
-0.071
-14.1%
jan 1, 1988
0.54
+0.106
24.48%
jan 1, 1989
0.521
-0.019
-3.54%
jan 1, 1990
0.55
+0.029
5.59%
jan 1, 1991
0.512
-0.039
-7.05%
jan 1, 1992
0.537
+0.025
4.92%
jan 1, 1993
0.59
+0.053
9.87%
jan 1, 1994
0.614
+0.024
4.11%
jan 1, 1995
0.604
-0.01
-1.62%
jan 1, 1996
0.602
-0.002
-0.4%
jan 1, 1997
0.606
+0.004
0.66%
jan 1, 1998
0.674
+0.068
11.21%
jan 1, 1999
0.668
-0.006
-0.85%
jan 1, 2000
0.694
+0.026
3.85%
jan 1, 2001
0.712
+0.018
2.65%
jan 1, 2002
0.765
+0.053
7.45%
jan 1, 2003
0.82
+0.055
7.19%
jan 1, 2004
0.913
+0.093
11.36%
jan 1, 2005
1.014
+0.101
11.08%
jan 1, 2006
1.122
+0.107
10.57%
jan 1, 2007
1.233
+0.112
9.96%
jan 1, 2008
1.441
+0.208
16.88%
jan 1, 2009
1.643
+0.201
13.95%
jan 1, 2010
1.81
+0.168
10.21%
jan 1, 2011
2.088
+0.278
15.34%
jan 1, 2012
2.427
+0.339
16.25%
jan 1, 2013
2.767
+0.339
13.97%
jan 1, 2014
3.172
+0.406
14.67%
jan 1, 2015
3.676
+0.504
15.88%
Ranking of countries by current statistics by years


Comments: