29
/
en
AIzaSyAYiBZKx7MnpbEhh9jyipgxe19OcubqV5w
April 1, 2024
215668
Oman
OMN
true
2
1
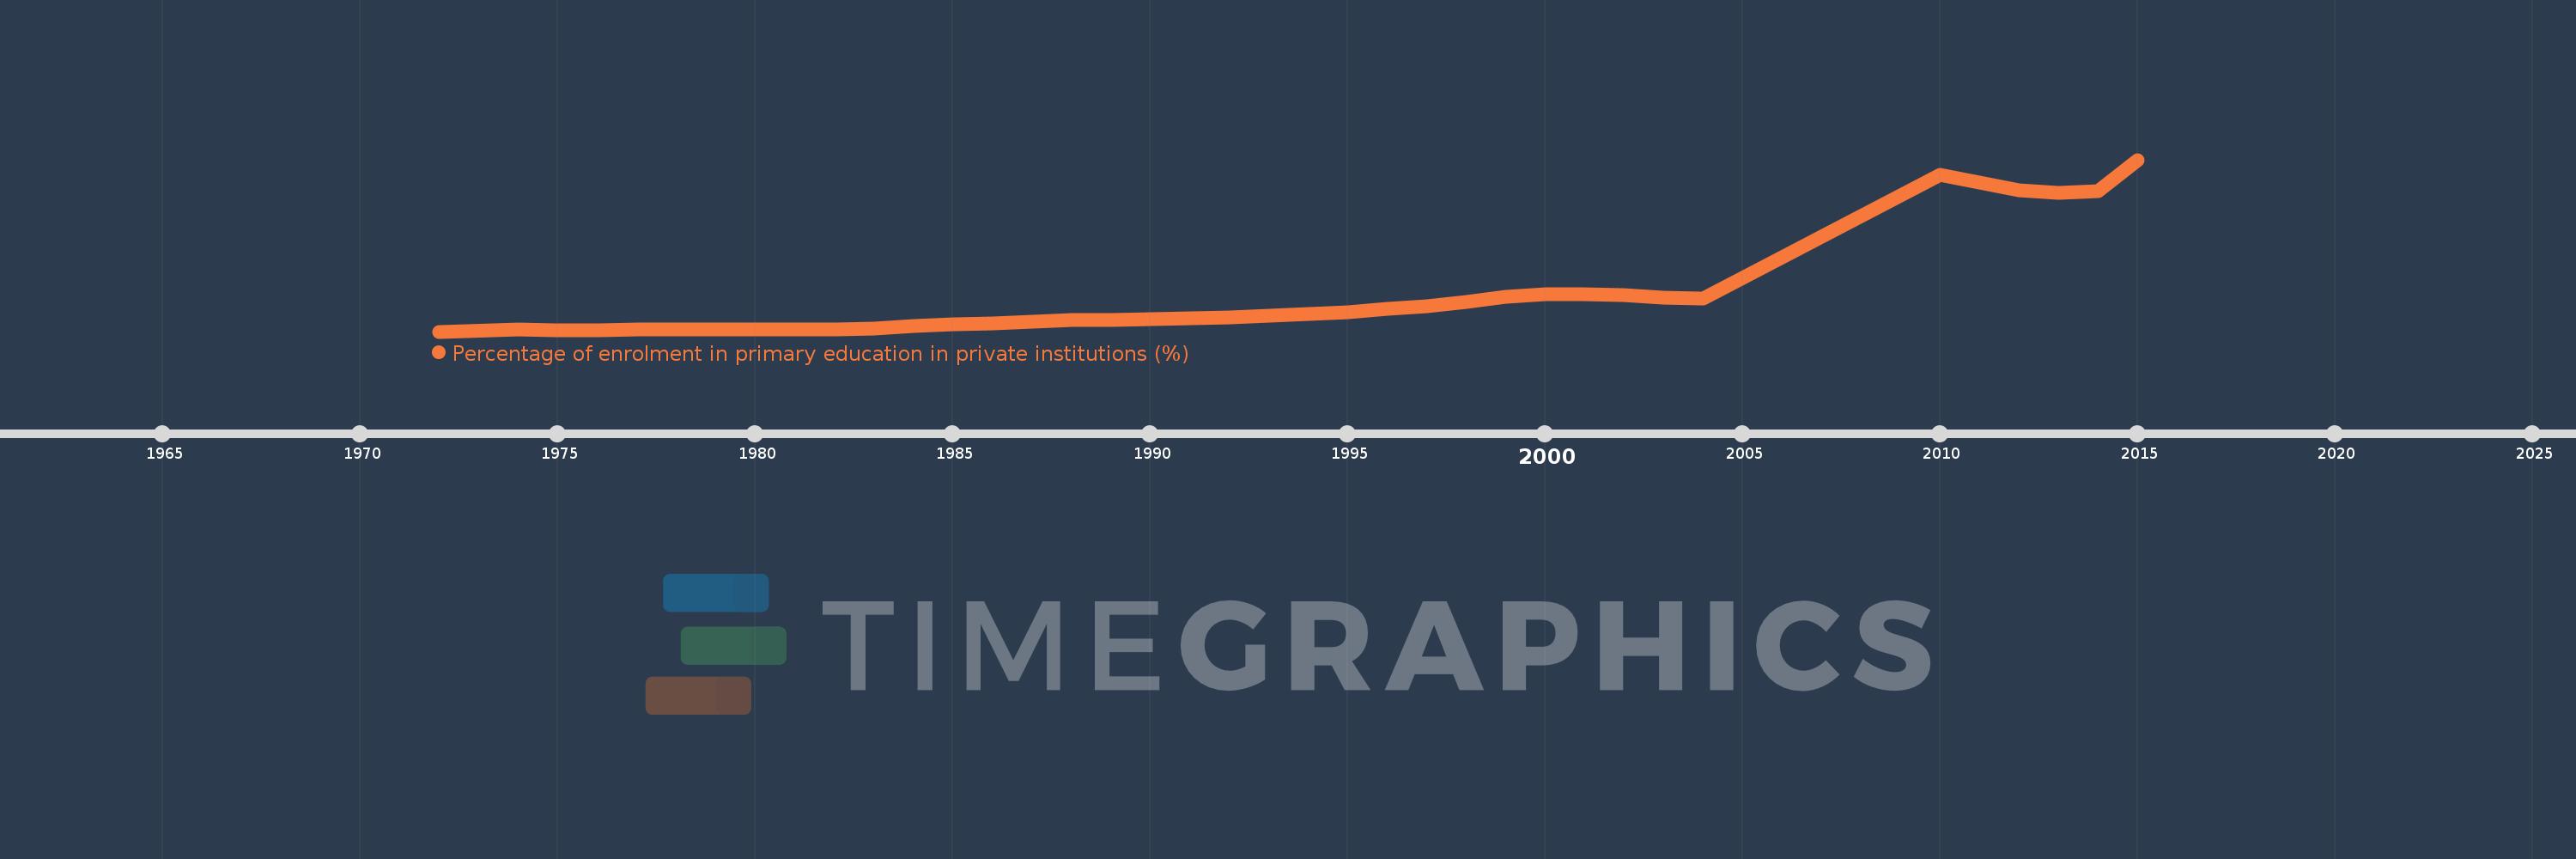
Percentage of enrolment in primary education in private institutions (%)
2015,2014,2013,2012,2010,2004,2003,2002,2001,2000,1999,1998,1997,1996,1995,1994,1993,1992,1991,1990,1989,1988,1987,1986,1985,1984,1983,1982,1977,1976,1975,1974,1972
This statistics in other country:
AfghanistanAlbaniaAlgeriaAndorraAngolaAntigua and BarbudaArab WorldArgentinaArmeniaArubaAustraliaAustriaAzerbaijanBahamas, TheBahrainBangladeshBarbadosBelarusBelgiumBelizeBeninBermudaBhutanBoliviaBosnia and HerzegovinaBotswanaBrazilBritish Virgin IslandsBrunei DarussalamBulgariaBurkina FasoBurundiCabo VerdeCambodiaCameroonCanadaCaribbean small statesCayman IslandsCentral African RepublicCentral Europe and the BalticsChadChileChinaColombiaComorosCongo, Dem. Rep.Congo, Rep.Costa RicaCote d'IvoireCroatiaCubaCuracaoCyprusCzech RepublicDenmarkDjiboutiDominicaDominican RepublicEarly-demographic dividendEast Asia & PacificEast Asia & Pacific (excluding high income)East Asia & Pacific (IDA & IBRD countries)EcuadorEgypt, Arab Rep.El SalvadorEquatorial GuineaEritreaEstoniaEthiopiaEuro areaEurope & Central AsiaEurope & Central Asia (excluding high income)Europe & Central Asia (IDA & IBRD countries)European UnionFijiFinlandFragile and conflict affected situationsFranceGabonGambia, TheGeorgiaGermanyGhanaGibraltarGreeceGrenadaGuatemalaGuineaGuinea-BissauGuyanaHaitiHeavily indebted poor countries (HIPC)High incomeHondurasHong Kong SAR, ChinaHungaryIBRD onlyIcelandIDA & IBRD totalIDA blendIDA onlyIDA totalIndiaIndonesiaIran, Islamic Rep.IraqIrelandIsraelItalyJamaicaJapanJordanKazakhstanKenyaKiribatiKorea, Rep.KuwaitKyrgyz RepublicLao PDRLate-demographic dividendLatin America & Caribbean Latin America & Caribbean (excluding high income)Latin America & the Caribbean (IDA & IBRD countries)LatviaLeast developed countries: UN classificationLebanonLesothoLiberiaLibyaLiechtensteinLithuaniaLow & middle incomeLow incomeLower middle incomeLuxembourgMacao SAR, ChinaMacedonia, FYRMadagascarMalawiMalaysiaMaldivesMaliMaltaMarshall IslandsMauritaniaMauritiusMexicoMiddle East & North AfricaMiddle East & North Africa (excluding high income)Middle East & North Africa (IDA & IBRD countries)Middle incomeMoldovaMonacoMongoliaMoroccoMozambiqueMyanmarNamibiaNauruNepalNetherlandsNew ZealandNicaraguaNigerNigeriaNorth AmericaNorwayOECD membersOmanOther small statesPacific island small statesPakistanPalauPanamaPapua New GuineaParaguayPeruPhilippinesPolandPortugalPost-demographic dividendPre-demographic dividendPuerto RicoQatarRomaniaRussian FederationRwandaSamoaSan MarinoSao Tome and PrincipeSaudi ArabiaSenegalSerbiaSeychellesSierra LeoneSingaporeSlovak RepublicSloveniaSmall statesSolomon IslandsSomaliaSouth AfricaSouth AsiaSouth Asia (IDA & IBRD)SpainSri LankaSt. Kitts and NevisSt. LuciaSt. Vincent and the GrenadinesSub-Saharan Africa Sub-Saharan Africa (excluding high income)Sub-Saharan Africa (IDA & IBRD countries)SudanSurinameSwazilandSwedenSwitzerlandSyrian Arab RepublicTajikistanTanzaniaThailandTimor-LesteTogoTongaTrinidad and TobagoTunisiaTurkeyTurks and Caicos IslandsTuvaluUgandaUkraineUnited Arab EmiratesUnited KingdomUnited StatesUpper middle incomeUruguayVanuatuVenezuela, RBVietnamWest Bank and GazaWorldYemen, Rep.ZambiaZimbabwe Timeline:
This timeline shows a graph from 1972 to 2015 of Oman. No data until 1971. Number of actual observations by date: 33.
Source name:
World Development Indicators
Source organization:
UNESCO Institute for Statistics
Categories, topics:
Education
Last updated:
apr 23, 2017
Indicators value changes by year
Maximum:
20.955
jan 1, 2015
At the date of observation
Value
Absolute change
Change from previous value
jan 1, 1974
0.311
+0.311
%
jan 1, 1975
0.184
-0.127
-40.84%
jan 1, 1976
0.15
-0.034
-18.54%
jan 1, 1977
0.282
+0.132
87.93%
jan 1, 1982
0.264
-0.018
-6.23%
jan 1, 1983
0.417
+0.152
57.55%
jan 1, 1984
0.706
+0.289
69.44%
jan 1, 1985
0.858
+0.152
21.51%
jan 1, 1986
0.993
+0.135
15.73%
jan 1, 1987
1.177
+0.184
18.53%
jan 1, 1988
1.385
+0.209
17.73%
jan 1, 1989
1.434
+0.048
3.49%
jan 1, 1990
1.493
+0.06
4.17%
jan 1, 1991
1.673
+0.18
12.03%
jan 1, 1992
1.749
+0.076
4.54%
jan 1, 1993
1.912
+0.163
9.31%
jan 1, 1994
2.096
+0.185
9.66%
jan 1, 1995
2.359
+0.262
12.52%
jan 1, 1996
2.767
+0.409
17.32%
jan 1, 1997
3.114
+0.347
12.54%
jan 1, 1998
3.606
+0.491
15.78%
jan 1, 1999
4.225
+0.619
17.18%
jan 1, 2000
4.524
+0.299
7.08%
jan 1, 2001
4.514
-0.01
-0.23%
jan 1, 2002
4.495
-0.019
-0.42%
jan 1, 2003
4.144
-0.351
-7.8%
jan 1, 2004
4.032
-0.112
-2.71%
jan 1, 2010
19.075
+15.043
373.13%
jan 1, 2012
17.227
-1.848
-9.69%
jan 1, 2013
16.9
-0.326
-1.89%
jan 1, 2014
17.131
+0.231
1.37%
jan 1, 2015
20.955
+3.824
22.32%
Ranking of countries by current statistics by years


Comments: