29
/
en
AIzaSyAYiBZKx7MnpbEhh9jyipgxe19OcubqV5w
April 1, 2024
61077
Sub-Saharan Africa (IDA & IBRD countries)
TSS
false
2
1
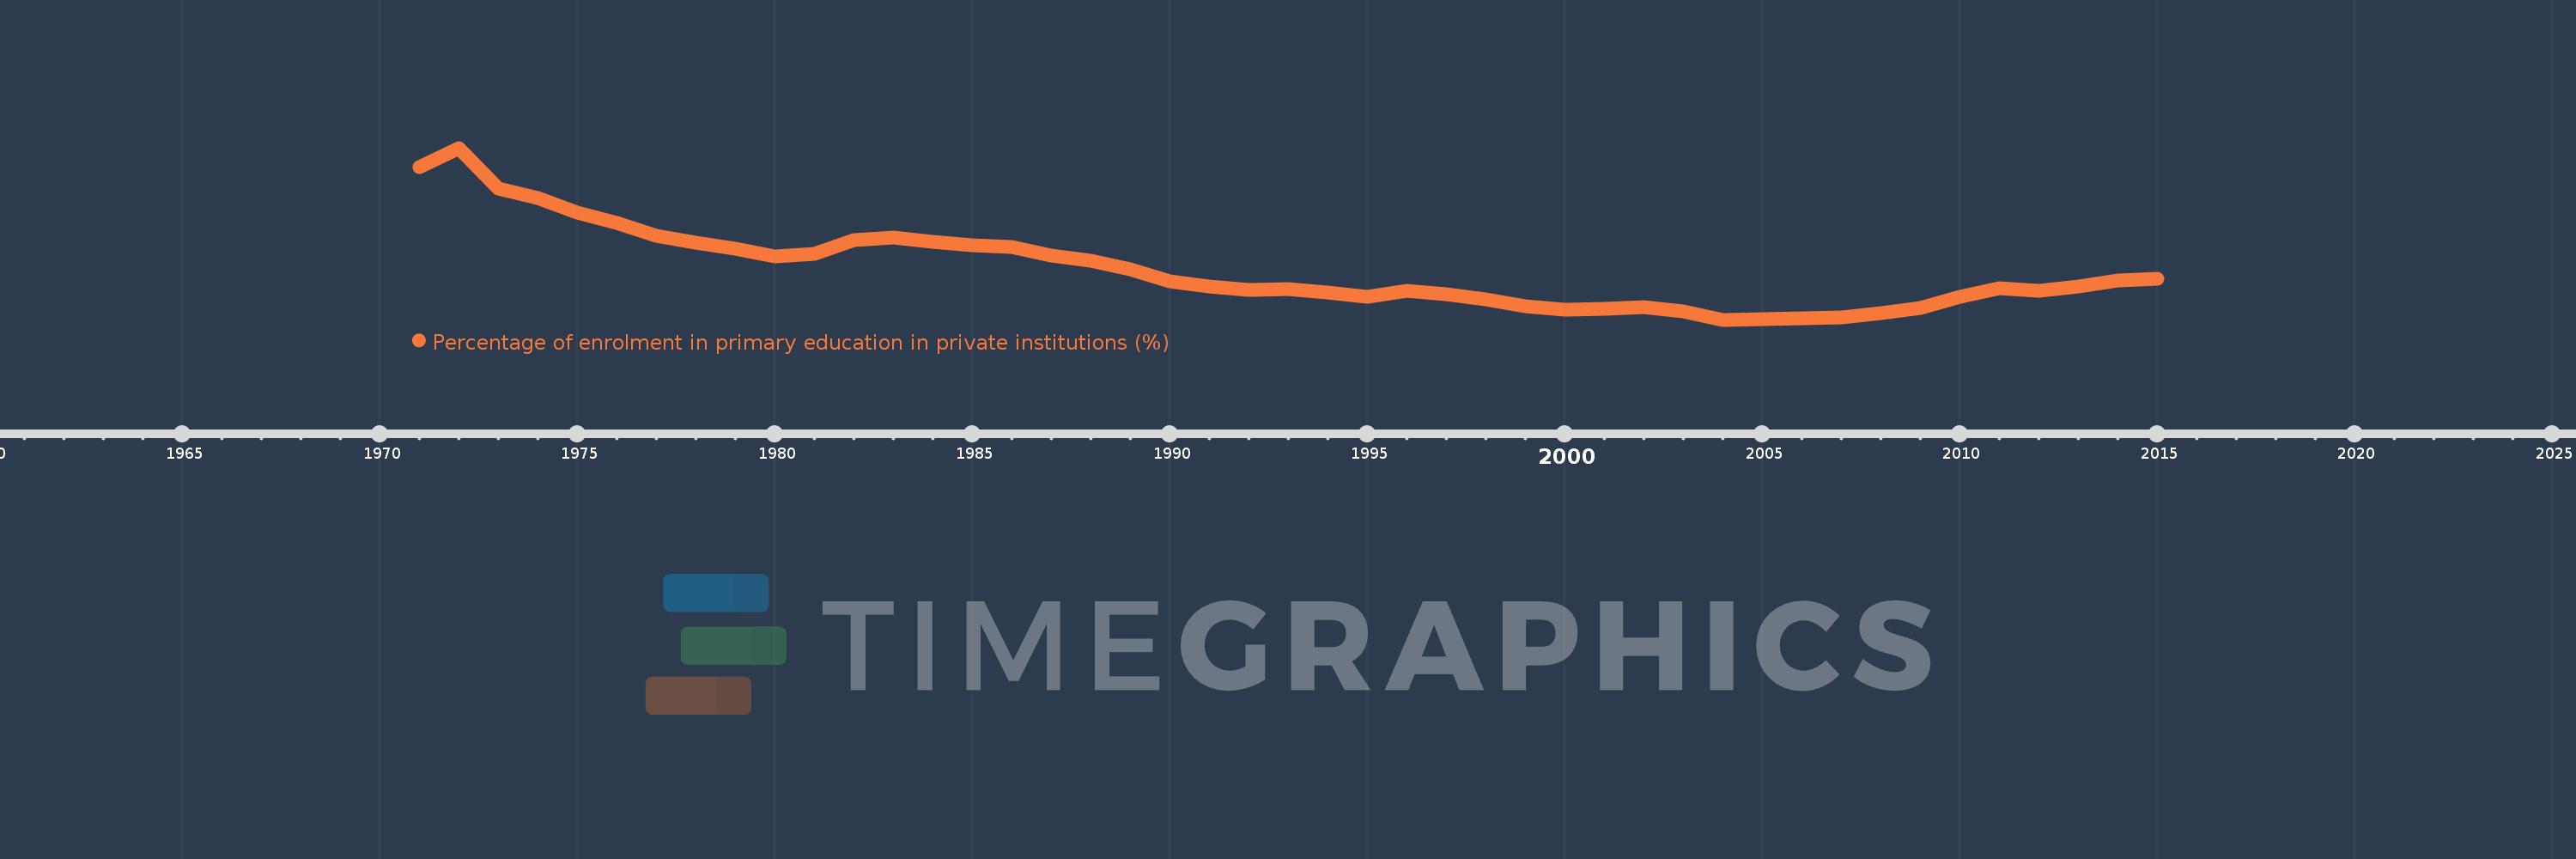
Percentage of enrolment in primary education in private institutions (%)
2015,2014,2013,2012,2011,2010,2009,2008,2007,2006,2005,2004,2003,2002,2001,2000,1999,1998,1997,1996,1995,1994,1993,1992,1991,1990,1989,1988,1987,1986,1985,1984,1983,1982,1981,1980,1979,1978,1977,1976,1975,1974,1973,1972,1971
This statistics in other country:
AfghanistanAlbaniaAlgeriaAndorraAngolaAntigua and BarbudaArab WorldArgentinaArmeniaArubaAustraliaAustriaAzerbaijanBahamas, TheBahrainBangladeshBarbadosBelarusBelgiumBelizeBeninBermudaBhutanBoliviaBosnia and HerzegovinaBotswanaBrazilBritish Virgin IslandsBrunei DarussalamBulgariaBurkina FasoBurundiCabo VerdeCambodiaCameroonCanadaCaribbean small statesCayman IslandsCentral African RepublicCentral Europe and the BalticsChadChileChinaColombiaComorosCongo, Dem. Rep.Congo, Rep.Costa RicaCote d'IvoireCroatiaCubaCuracaoCyprusCzech RepublicDenmarkDjiboutiDominicaDominican RepublicEarly-demographic dividendEast Asia & PacificEast Asia & Pacific (excluding high income)East Asia & Pacific (IDA & IBRD countries)EcuadorEgypt, Arab Rep.El SalvadorEquatorial GuineaEritreaEstoniaEthiopiaEuro areaEurope & Central AsiaEurope & Central Asia (excluding high income)Europe & Central Asia (IDA & IBRD countries)European UnionFijiFinlandFragile and conflict affected situationsFranceGabonGambia, TheGeorgiaGermanyGhanaGibraltarGreeceGrenadaGuatemalaGuineaGuinea-BissauGuyanaHaitiHeavily indebted poor countries (HIPC)High incomeHondurasHong Kong SAR, ChinaHungaryIBRD onlyIcelandIDA & IBRD totalIDA blendIDA onlyIDA totalIndiaIndonesiaIran, Islamic Rep.IraqIrelandIsraelItalyJamaicaJapanJordanKazakhstanKenyaKiribatiKorea, Rep.KuwaitKyrgyz RepublicLao PDRLate-demographic dividendLatin America & Caribbean Latin America & Caribbean (excluding high income)Latin America & the Caribbean (IDA & IBRD countries)LatviaLeast developed countries: UN classificationLebanonLesothoLiberiaLibyaLiechtensteinLithuaniaLow & middle incomeLow incomeLower middle incomeLuxembourgMacao SAR, ChinaMacedonia, FYRMadagascarMalawiMalaysiaMaldivesMaliMaltaMarshall IslandsMauritaniaMauritiusMexicoMiddle East & North AfricaMiddle East & North Africa (excluding high income)Middle East & North Africa (IDA & IBRD countries)Middle incomeMoldovaMonacoMongoliaMoroccoMozambiqueMyanmarNamibiaNauruNepalNetherlandsNew ZealandNicaraguaNigerNigeriaNorth AmericaNorwayOECD membersOmanOther small statesPacific island small statesPakistanPalauPanamaPapua New GuineaParaguayPeruPhilippinesPolandPortugalPost-demographic dividendPre-demographic dividendPuerto RicoQatarRomaniaRussian FederationRwandaSamoaSan MarinoSao Tome and PrincipeSaudi ArabiaSenegalSerbiaSeychellesSierra LeoneSingaporeSlovak RepublicSloveniaSmall statesSolomon IslandsSomaliaSouth AfricaSouth AsiaSouth Asia (IDA & IBRD)SpainSri LankaSt. Kitts and NevisSt. LuciaSt. Vincent and the GrenadinesSub-Saharan Africa Sub-Saharan Africa (excluding high income)Sub-Saharan Africa (IDA & IBRD countries)SudanSurinameSwazilandSwedenSwitzerlandSyrian Arab RepublicTajikistanTanzaniaThailandTimor-LesteTogoTongaTrinidad and TobagoTunisiaTurkeyTurks and Caicos IslandsTuvaluUgandaUkraineUnited Arab EmiratesUnited KingdomUnited StatesUpper middle incomeUruguayVanuatuVenezuela, RBVietnamWest Bank and GazaWorldYemen, Rep.ZambiaZimbabwe Timeline:
This timeline shows a graph from 1971 to 2015 of Sub-Saharan Africa (IDA & IBRD countries). No data until 1970. Number of actual observations by date: 45.
Source name:
World Development Indicators
Source organization:
UNESCO Institute for Statistics
Categories, topics:
Education
Last updated:
apr 23, 2017
Indicators value changes by year
Maximum:
17.451
jan 1, 1972
At the date of observation
Value
Absolute change
Change from previous value
jan 1, 1971
16.557
+16.557
0.0%
jan 1, 1972
17.451
+0.894
5.4%
jan 1, 1973
15.587
-1.864
-10.68%
jan 1, 1974
15.146
-0.441
-2.83%
jan 1, 1975
14.47
-0.676
-4.47%
jan 1, 1976
14.007
-0.463
-3.2%
jan 1, 1977
13.434
-0.573
-4.09%
jan 1, 1978
13.102
-0.331
-2.47%
jan 1, 1979
12.823
-0.28
-2.13%
jan 1, 1980
12.48
-0.343
-2.67%
jan 1, 1981
12.618
+0.138
1.11%
jan 1, 1982
13.215
+0.597
4.73%
jan 1, 1983
13.35
+0.134
1.02%
jan 1, 1984
13.165
-0.185
-1.39%
jan 1, 1985
13.005
-0.16
-1.22%
jan 1, 1986
12.919
-0.086
-0.66%
jan 1, 1987
12.536
-0.383
-2.97%
jan 1, 1988
12.267
-0.268
-2.14%
jan 1, 1989
11.881
-0.386
-3.14%
jan 1, 1990
11.332
-0.55
-4.63%
jan 1, 1991
11.104
-0.228
-2.01%
jan 1, 1992
10.938
-0.166
-1.5%
jan 1, 1993
10.994
+0.056
0.52%
jan 1, 1994
10.823
-0.171
-1.56%
jan 1, 1995
10.637
-0.186
-1.72%
jan 1, 1996
10.89
+0.253
2.38%
jan 1, 1997
10.752
-0.138
-1.27%
jan 1, 1998
10.523
-0.23
-2.14%
jan 1, 1999
10.206
-0.317
-3.01%
jan 1, 2000
10.061
-0.145
-1.42%
jan 1, 2001
10.093
+0.032
0.32%
jan 1, 2002
10.164
+0.071
0.7%
jan 1, 2003
9.967
-0.197
-1.94%
jan 1, 2004
9.583
-0.384
-3.85%
jan 1, 2005
9.593
+0.01
0.1%
jan 1, 2006
9.638
+0.045
0.47%
jan 1, 2007
9.671
+0.033
0.34%
jan 1, 2008
9.883
+0.211
2.19%
jan 1, 2009
10.113
+0.231
2.33%
jan 1, 2010
10.619
+0.505
5.0%
jan 1, 2011
11.02
+0.401
3.78%
jan 1, 2012
10.9
-0.12
-1.09%
jan 1, 2013
11.117
+0.218
2.0%
jan 1, 2014
11.372
+0.254
2.29%
jan 1, 2015
11.447
+0.076
0.66%
Ranking of countries by current statistics by years


Comments: