29
/
en
AIzaSyAYiBZKx7MnpbEhh9jyipgxe19OcubqV5w
April 1, 2024
73329
Australia
AUS
true
2
1
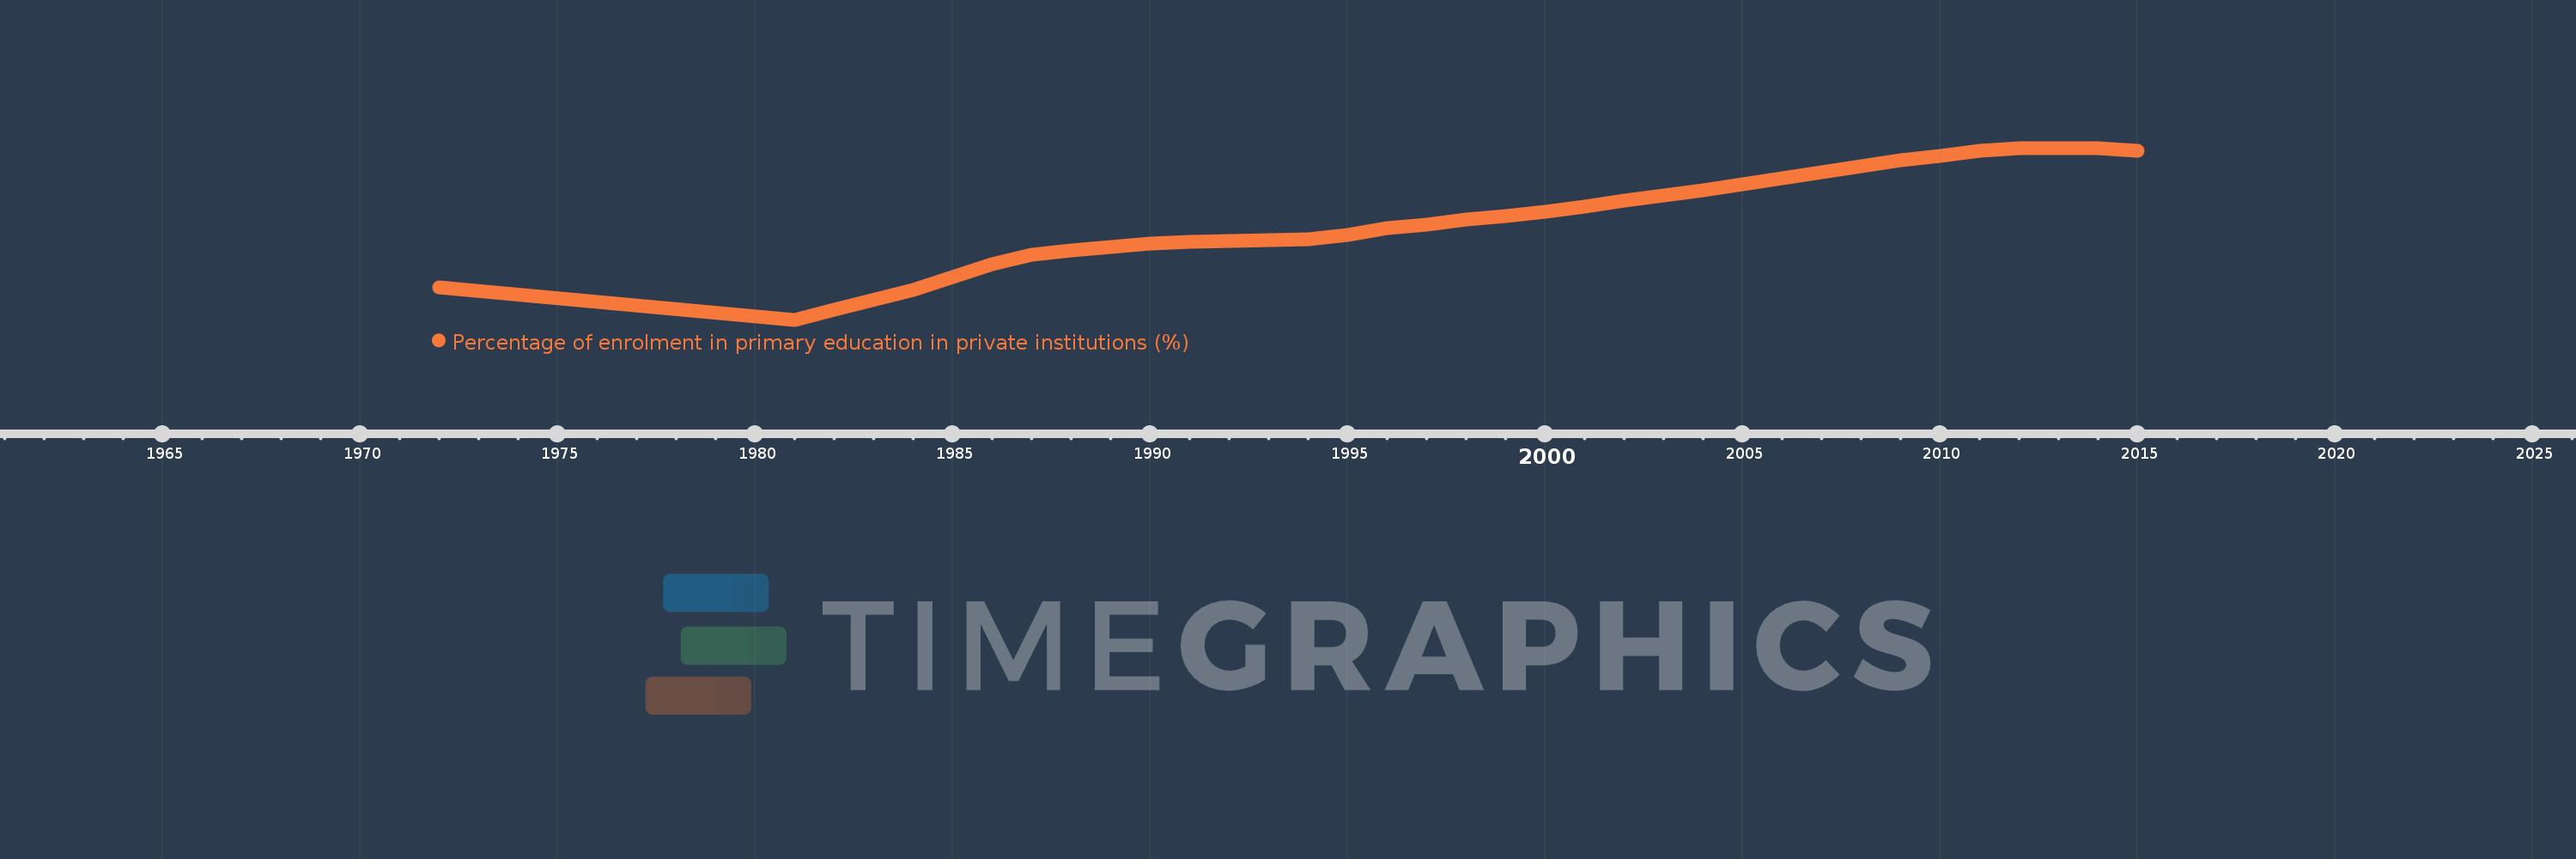
Percentage of enrolment in primary education in private institutions (%)
2015,2014,2013,2012,2011,2010,2009,2008,2007,2006,2005,2004,2003,2002,2001,2000,1999,1998,1997,1996,1995,1994,1993,1992,1991,1990,1989,1988,1987,1986,1985,1984,1982,1981,1972
This statistics in other country:
AfghanistanAlbaniaAlgeriaAndorraAngolaAntigua and BarbudaArab WorldArgentinaArmeniaArubaAustraliaAustriaAzerbaijanBahamas, TheBahrainBangladeshBarbadosBelarusBelgiumBelizeBeninBermudaBhutanBoliviaBosnia and HerzegovinaBotswanaBrazilBritish Virgin IslandsBrunei DarussalamBulgariaBurkina FasoBurundiCabo VerdeCambodiaCameroonCanadaCaribbean small statesCayman IslandsCentral African RepublicCentral Europe and the BalticsChadChileChinaColombiaComorosCongo, Dem. Rep.Congo, Rep.Costa RicaCote d'IvoireCroatiaCubaCuracaoCyprusCzech RepublicDenmarkDjiboutiDominicaDominican RepublicEarly-demographic dividendEast Asia & PacificEast Asia & Pacific (excluding high income)East Asia & Pacific (IDA & IBRD countries)EcuadorEgypt, Arab Rep.El SalvadorEquatorial GuineaEritreaEstoniaEthiopiaEuro areaEurope & Central AsiaEurope & Central Asia (excluding high income)Europe & Central Asia (IDA & IBRD countries)European UnionFijiFinlandFragile and conflict affected situationsFranceGabonGambia, TheGeorgiaGermanyGhanaGibraltarGreeceGrenadaGuatemalaGuineaGuinea-BissauGuyanaHaitiHeavily indebted poor countries (HIPC)High incomeHondurasHong Kong SAR, ChinaHungaryIBRD onlyIcelandIDA & IBRD totalIDA blendIDA onlyIDA totalIndiaIndonesiaIran, Islamic Rep.IraqIrelandIsraelItalyJamaicaJapanJordanKazakhstanKenyaKiribatiKorea, Rep.KuwaitKyrgyz RepublicLao PDRLate-demographic dividendLatin America & Caribbean Latin America & Caribbean (excluding high income)Latin America & the Caribbean (IDA & IBRD countries)LatviaLeast developed countries: UN classificationLebanonLesothoLiberiaLibyaLiechtensteinLithuaniaLow & middle incomeLow incomeLower middle incomeLuxembourgMacao SAR, ChinaMacedonia, FYRMadagascarMalawiMalaysiaMaldivesMaliMaltaMarshall IslandsMauritaniaMauritiusMexicoMiddle East & North AfricaMiddle East & North Africa (excluding high income)Middle East & North Africa (IDA & IBRD countries)Middle incomeMoldovaMonacoMongoliaMoroccoMozambiqueMyanmarNamibiaNauruNepalNetherlandsNew ZealandNicaraguaNigerNigeriaNorth AmericaNorwayOECD membersOmanOther small statesPacific island small statesPakistanPalauPanamaPapua New GuineaParaguayPeruPhilippinesPolandPortugalPost-demographic dividendPre-demographic dividendPuerto RicoQatarRomaniaRussian FederationRwandaSamoaSan MarinoSao Tome and PrincipeSaudi ArabiaSenegalSerbiaSeychellesSierra LeoneSingaporeSlovak RepublicSloveniaSmall statesSolomon IslandsSomaliaSouth AfricaSouth AsiaSouth Asia (IDA & IBRD)SpainSri LankaSt. Kitts and NevisSt. LuciaSt. Vincent and the GrenadinesSub-Saharan Africa Sub-Saharan Africa (excluding high income)Sub-Saharan Africa (IDA & IBRD countries)SudanSurinameSwazilandSwedenSwitzerlandSyrian Arab RepublicTajikistanTanzaniaThailandTimor-LesteTogoTongaTrinidad and TobagoTunisiaTurkeyTurks and Caicos IslandsTuvaluUgandaUkraineUnited Arab EmiratesUnited KingdomUnited StatesUpper middle incomeUruguayVanuatuVenezuela, RBVietnamWest Bank and GazaWorldYemen, Rep.ZambiaZimbabwe Timeline:
This timeline shows a graph from 1972 to 2015 of Australia. No data until 1971. Number of actual observations by date: 35.
Source name:
World Development Indicators
Source organization:
UNESCO Institute for Statistics
Categories, topics:
Education
Last updated:
apr 23, 2017
Indicators value changes by year
Minimum:
19.717
jan 1, 1981
Maximum:
31.085
jan 1, 2013
At the date of observation
Value
Absolute change
Change from previous value
jan 1, 1972
21.859
+21.859
0.0%
jan 1, 1981
19.717
-2.142
-9.8%
jan 1, 1982
20.379
+0.662
3.36%
jan 1, 1984
21.708
+1.329
6.52%
jan 1, 1985
22.537
+0.829
3.82%
jan 1, 1986
23.403
+0.866
3.84%
jan 1, 1987
23.997
+0.594
2.54%
jan 1, 1988
24.299
+0.301
1.25%
jan 1, 1989
24.559
+0.261
1.07%
jan 1, 1990
24.778
+0.219
0.89%
jan 1, 1991
24.873
+0.095
0.38%
jan 1, 1992
24.944
+0.071
0.28%
jan 1, 1993
24.97
+0.026
0.1%
jan 1, 1994
25.055
+0.085
0.34%
jan 1, 1995
25.353
+0.299
1.19%
jan 1, 1996
25.762
+0.409
1.61%
jan 1, 1997
26.013
+0.251
0.97%
jan 1, 1998
26.338
+0.325
1.25%
jan 1, 1999
26.602
+0.264
1.0%
jan 1, 2000
26.863
+0.261
0.98%
jan 1, 2001
27.219
+0.356
1.32%
jan 1, 2002
27.604
+0.385
1.42%
jan 1, 2003
27.966
+0.362
1.31%
jan 1, 2004
28.302
+0.336
1.2%
jan 1, 2005
28.677
+0.374
1.32%
jan 1, 2006
29.098
+0.421
1.47%
jan 1, 2007
29.455
+0.357
1.23%
jan 1, 2008
29.846
+0.391
1.33%
jan 1, 2009
30.263
+0.417
1.4%
jan 1, 2010
30.55
+0.287
0.95%
jan 1, 2011
30.872
+0.323
1.06%
jan 1, 2012
31.082
+0.209
0.68%
jan 1, 2013
31.085
+0.003
0.01%
jan 1, 2014
31.044
-0.04
-0.13%
jan 1, 2015
30.907
-0.137
-0.44%
Ranking of countries by current statistics by years


Comments: