29
/
en
AIzaSyAYiBZKx7MnpbEhh9jyipgxe19OcubqV5w
April 1, 2024
226276
Portugal
PRT
true
2
1
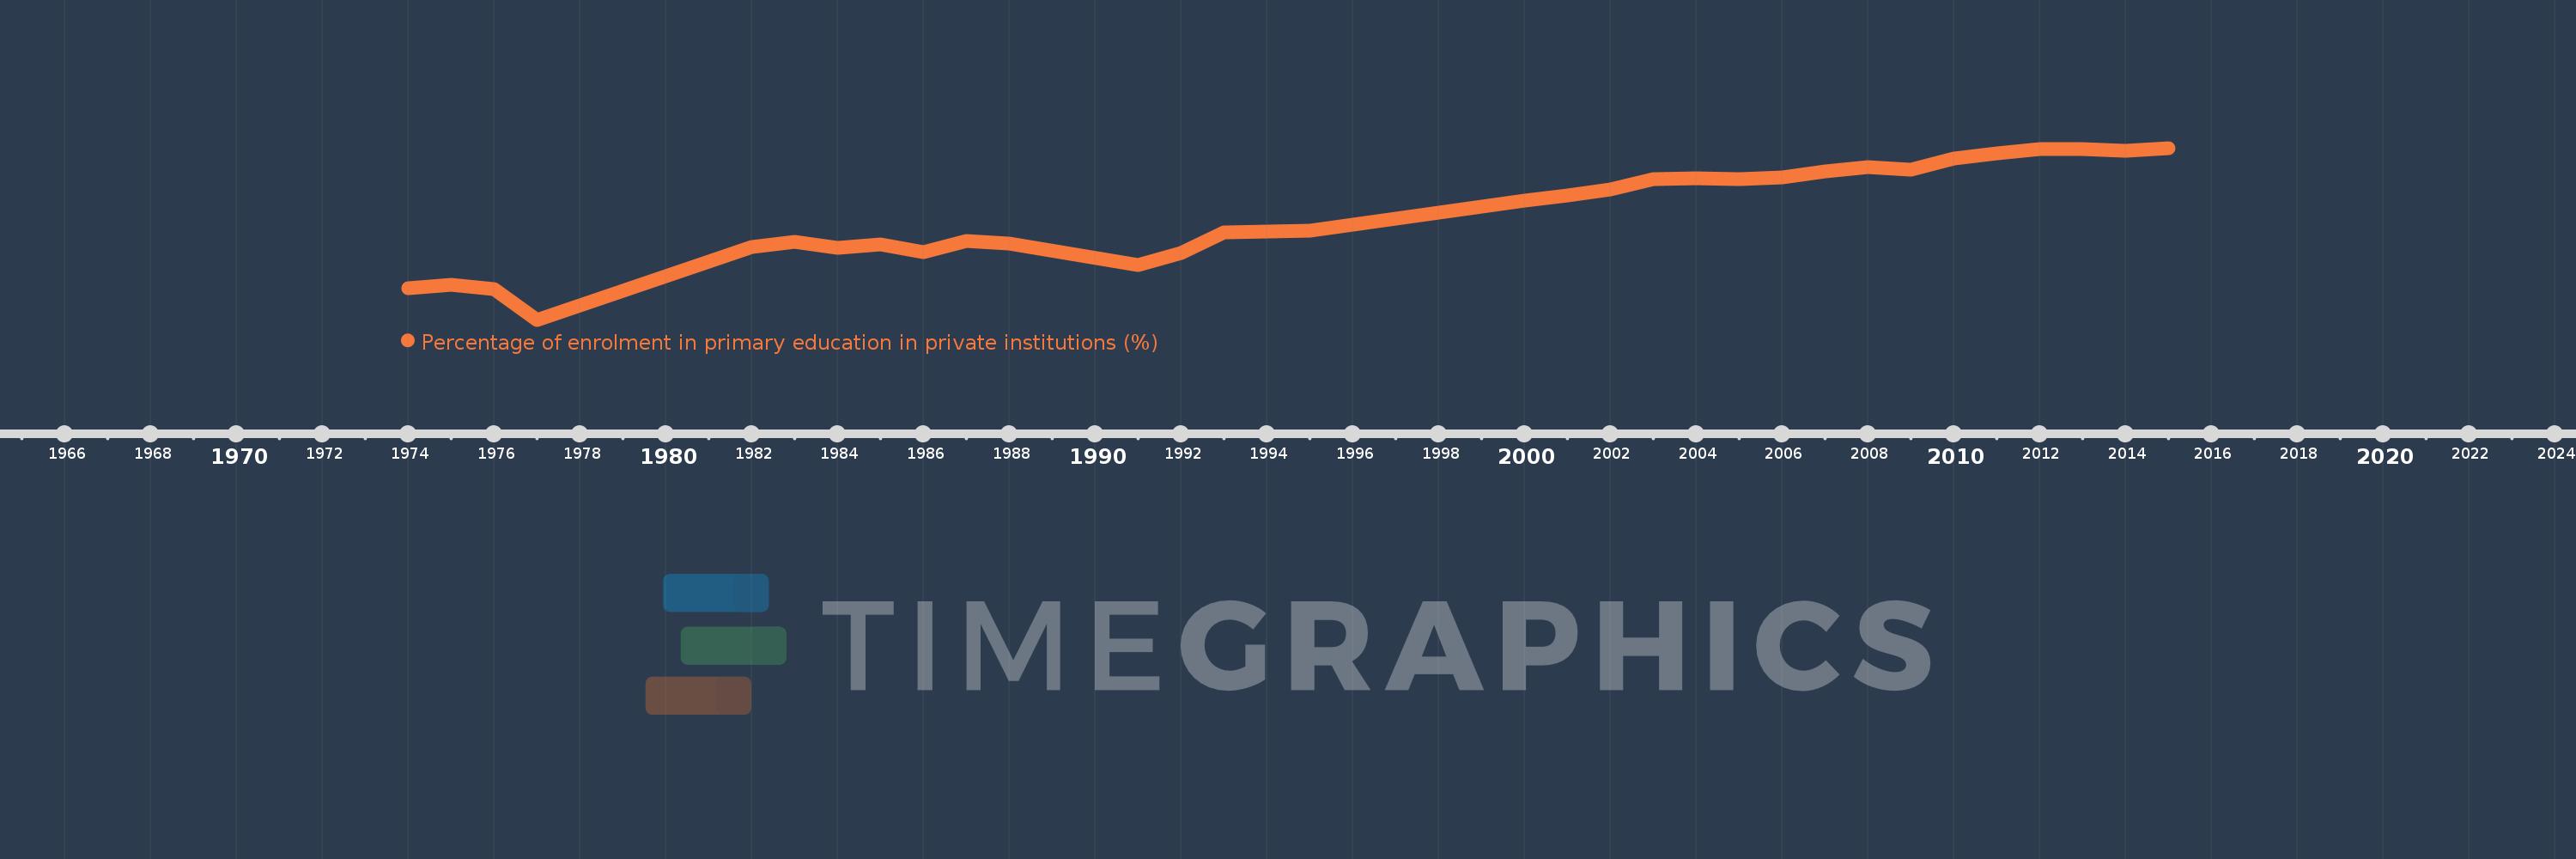
Percentage of enrolment in primary education in private institutions (%)
2015,2014,2013,2012,2011,2010,2009,2008,2007,2006,2005,2004,2003,2002,2001,2000,1995,1994,1993,1992,1991,1988,1987,1986,1985,1984,1983,1982,1977,1976,1975,1974
This statistics in other country:
AfghanistanAlbaniaAlgeriaAndorraAngolaAntigua and BarbudaArab WorldArgentinaArmeniaArubaAustraliaAustriaAzerbaijanBahamas, TheBahrainBangladeshBarbadosBelarusBelgiumBelizeBeninBermudaBhutanBoliviaBosnia and HerzegovinaBotswanaBrazilBritish Virgin IslandsBrunei DarussalamBulgariaBurkina FasoBurundiCabo VerdeCambodiaCameroonCanadaCaribbean small statesCayman IslandsCentral African RepublicCentral Europe and the BalticsChadChileChinaColombiaComorosCongo, Dem. Rep.Congo, Rep.Costa RicaCote d'IvoireCroatiaCubaCuracaoCyprusCzech RepublicDenmarkDjiboutiDominicaDominican RepublicEarly-demographic dividendEast Asia & PacificEast Asia & Pacific (excluding high income)East Asia & Pacific (IDA & IBRD countries)EcuadorEgypt, Arab Rep.El SalvadorEquatorial GuineaEritreaEstoniaEthiopiaEuro areaEurope & Central AsiaEurope & Central Asia (excluding high income)Europe & Central Asia (IDA & IBRD countries)European UnionFijiFinlandFragile and conflict affected situationsFranceGabonGambia, TheGeorgiaGermanyGhanaGibraltarGreeceGrenadaGuatemalaGuineaGuinea-BissauGuyanaHaitiHeavily indebted poor countries (HIPC)High incomeHondurasHong Kong SAR, ChinaHungaryIBRD onlyIcelandIDA & IBRD totalIDA blendIDA onlyIDA totalIndiaIndonesiaIran, Islamic Rep.IraqIrelandIsraelItalyJamaicaJapanJordanKazakhstanKenyaKiribatiKorea, Rep.KuwaitKyrgyz RepublicLao PDRLate-demographic dividendLatin America & Caribbean Latin America & Caribbean (excluding high income)Latin America & the Caribbean (IDA & IBRD countries)LatviaLeast developed countries: UN classificationLebanonLesothoLiberiaLibyaLiechtensteinLithuaniaLow & middle incomeLow incomeLower middle incomeLuxembourgMacao SAR, ChinaMacedonia, FYRMadagascarMalawiMalaysiaMaldivesMaliMaltaMarshall IslandsMauritaniaMauritiusMexicoMiddle East & North AfricaMiddle East & North Africa (excluding high income)Middle East & North Africa (IDA & IBRD countries)Middle incomeMoldovaMonacoMongoliaMoroccoMozambiqueMyanmarNamibiaNauruNepalNetherlandsNew ZealandNicaraguaNigerNigeriaNorth AmericaNorwayOECD membersOmanOther small statesPacific island small statesPakistanPalauPanamaPapua New GuineaParaguayPeruPhilippinesPolandPortugalPost-demographic dividendPre-demographic dividendPuerto RicoQatarRomaniaRussian FederationRwandaSamoaSan MarinoSao Tome and PrincipeSaudi ArabiaSenegalSerbiaSeychellesSierra LeoneSingaporeSlovak RepublicSloveniaSmall statesSolomon IslandsSomaliaSouth AfricaSouth AsiaSouth Asia (IDA & IBRD)SpainSri LankaSt. Kitts and NevisSt. LuciaSt. Vincent and the GrenadinesSub-Saharan Africa Sub-Saharan Africa (excluding high income)Sub-Saharan Africa (IDA & IBRD countries)SudanSurinameSwazilandSwedenSwitzerlandSyrian Arab RepublicTajikistanTanzaniaThailandTimor-LesteTogoTongaTrinidad and TobagoTunisiaTurkeyTurks and Caicos IslandsTuvaluUgandaUkraineUnited Arab EmiratesUnited KingdomUnited StatesUpper middle incomeUruguayVanuatuVenezuela, RBVietnamWest Bank and GazaWorldYemen, Rep.ZambiaZimbabwe Timeline:
This timeline shows a graph from 1974 to 2015 of Portugal. No data until 1973. Number of actual observations by date: 32.
Source name:
World Development Indicators
Source organization:
UNESCO Institute for Statistics
Categories, topics:
Education
Last updated:
apr 23, 2017
Indicators value changes by year
Maximum:
12.075
jan 1, 2015
At the date of observation
Value
Absolute change
Change from previous value
jan 1, 1974
4.867
+4.867
0.0%
jan 1, 1975
5.034
+0.167
3.42%
jan 1, 1976
4.85
-0.184
-3.66%
jan 1, 1977
3.262
-1.588
-32.74%
jan 1, 1982
7.006
+3.744
114.77%
jan 1, 1983
7.263
+0.257
3.67%
jan 1, 1984
6.935
-0.328
-4.51%
jan 1, 1985
7.121
+0.186
2.69%
jan 1, 1986
6.713
-0.408
-5.73%
jan 1, 1987
7.286
+0.573
8.53%
jan 1, 1988
7.15
-0.136
-1.86%
jan 1, 1991
6.079
-1.071
-14.99%
jan 1, 1992
6.67
+0.591
9.73%
jan 1, 1993
7.75
+1.08
16.19%
jan 1, 1994
7.767
+0.017
0.22%
jan 1, 1995
7.843
+0.076
0.98%
jan 1, 2000
9.393
+1.549
19.75%
jan 1, 2001
9.645
+0.253
2.69%
jan 1, 2002
9.961
+0.316
3.27%
jan 1, 2003
10.491
+0.53
5.32%
jan 1, 2004
10.536
+0.045
0.43%
jan 1, 2005
10.496
-0.04
-0.38%
jan 1, 2006
10.553
+0.057
0.54%
jan 1, 2007
10.851
+0.298
2.82%
jan 1, 2008
11.079
+0.228
2.1%
jan 1, 2009
10.945
-0.133
-1.2%
jan 1, 2010
11.522
+0.577
5.27%
jan 1, 2011
11.806
+0.284
2.47%
jan 1, 2012
12.023
+0.216
1.83%
jan 1, 2013
12.027
+0.005
0.04%
jan 1, 2014
11.936
-0.091
-0.76%
jan 1, 2015
12.075
+0.139
1.17%
Ranking of countries by current statistics by years


Comments: