29
/
en
AIzaSyAYiBZKx7MnpbEhh9jyipgxe19OcubqV5w
April 1, 2024
112721
Costa Rica
CRI
true
2
1
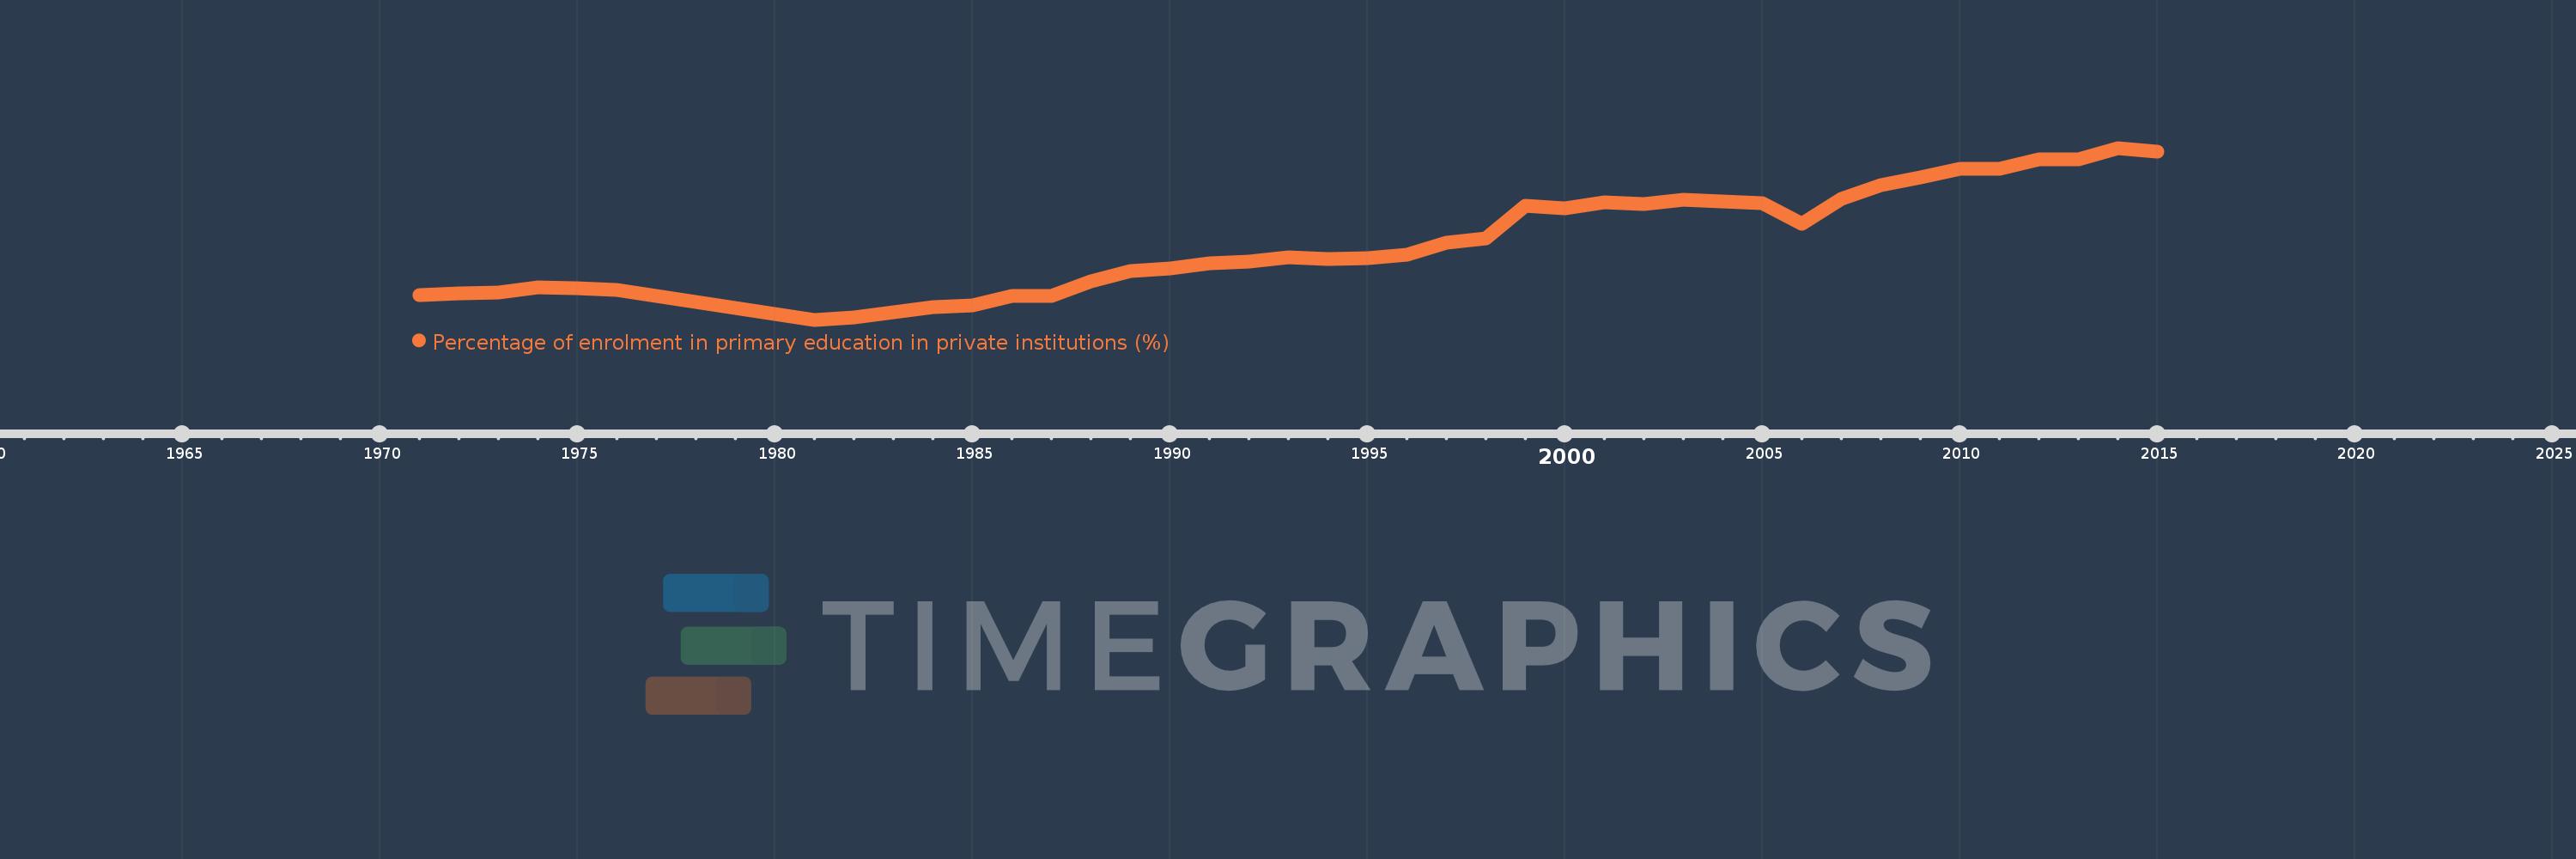
Percentage of enrolment in primary education in private institutions (%)
2015,2014,2013,2012,2011,2010,2009,2008,2007,2006,2005,2003,2002,2001,2000,1999,1998,1997,1996,1995,1994,1993,1992,1991,1990,1989,1988,1987,1986,1985,1984,1983,1982,1981,1976,1975,1974,1973,1972,1971
This statistics in other country:
AfghanistanAlbaniaAlgeriaAndorraAngolaAntigua and BarbudaArab WorldArgentinaArmeniaArubaAustraliaAustriaAzerbaijanBahamas, TheBahrainBangladeshBarbadosBelarusBelgiumBelizeBeninBermudaBhutanBoliviaBosnia and HerzegovinaBotswanaBrazilBritish Virgin IslandsBrunei DarussalamBulgariaBurkina FasoBurundiCabo VerdeCambodiaCameroonCanadaCaribbean small statesCayman IslandsCentral African RepublicCentral Europe and the BalticsChadChileChinaColombiaComorosCongo, Dem. Rep.Congo, Rep.Costa RicaCote d'IvoireCroatiaCubaCuracaoCyprusCzech RepublicDenmarkDjiboutiDominicaDominican RepublicEarly-demographic dividendEast Asia & PacificEast Asia & Pacific (excluding high income)East Asia & Pacific (IDA & IBRD countries)EcuadorEgypt, Arab Rep.El SalvadorEquatorial GuineaEritreaEstoniaEthiopiaEuro areaEurope & Central AsiaEurope & Central Asia (excluding high income)Europe & Central Asia (IDA & IBRD countries)European UnionFijiFinlandFragile and conflict affected situationsFranceGabonGambia, TheGeorgiaGermanyGhanaGibraltarGreeceGrenadaGuatemalaGuineaGuinea-BissauGuyanaHaitiHeavily indebted poor countries (HIPC)High incomeHondurasHong Kong SAR, ChinaHungaryIBRD onlyIcelandIDA & IBRD totalIDA blendIDA onlyIDA totalIndiaIndonesiaIran, Islamic Rep.IraqIrelandIsraelItalyJamaicaJapanJordanKazakhstanKenyaKiribatiKorea, Rep.KuwaitKyrgyz RepublicLao PDRLate-demographic dividendLatin America & Caribbean Latin America & Caribbean (excluding high income)Latin America & the Caribbean (IDA & IBRD countries)LatviaLeast developed countries: UN classificationLebanonLesothoLiberiaLibyaLiechtensteinLithuaniaLow & middle incomeLow incomeLower middle incomeLuxembourgMacao SAR, ChinaMacedonia, FYRMadagascarMalawiMalaysiaMaldivesMaliMaltaMarshall IslandsMauritaniaMauritiusMexicoMiddle East & North AfricaMiddle East & North Africa (excluding high income)Middle East & North Africa (IDA & IBRD countries)Middle incomeMoldovaMonacoMongoliaMoroccoMozambiqueMyanmarNamibiaNauruNepalNetherlandsNew ZealandNicaraguaNigerNigeriaNorth AmericaNorwayOECD membersOmanOther small statesPacific island small statesPakistanPalauPanamaPapua New GuineaParaguayPeruPhilippinesPolandPortugalPost-demographic dividendPre-demographic dividendPuerto RicoQatarRomaniaRussian FederationRwandaSamoaSan MarinoSao Tome and PrincipeSaudi ArabiaSenegalSerbiaSeychellesSierra LeoneSingaporeSlovak RepublicSloveniaSmall statesSolomon IslandsSomaliaSouth AfricaSouth AsiaSouth Asia (IDA & IBRD)SpainSri LankaSt. Kitts and NevisSt. LuciaSt. Vincent and the GrenadinesSub-Saharan Africa Sub-Saharan Africa (excluding high income)Sub-Saharan Africa (IDA & IBRD countries)SudanSurinameSwazilandSwedenSwitzerlandSyrian Arab RepublicTajikistanTanzaniaThailandTimor-LesteTogoTongaTrinidad and TobagoTunisiaTurkeyTurks and Caicos IslandsTuvaluUgandaUkraineUnited Arab EmiratesUnited KingdomUnited StatesUpper middle incomeUruguayVanuatuVenezuela, RBVietnamWest Bank and GazaWorldYemen, Rep.ZambiaZimbabwe Timeline:
This timeline shows a graph from 1971 to 2015 of Costa Rica. No data until 1970. Number of actual observations by date: 40.
Source name:
World Development Indicators
Source organization:
UNESCO Institute for Statistics
Categories, topics:
Education
Last updated:
apr 23, 2017
Indicators value changes by year
At the date of observation
Value
Absolute change
Change from previous value
jan 1, 1971
3.516
+3.516
0.0%
jan 1, 1972
3.569
+0.053
1.5%
jan 1, 1973
3.603
+0.034
0.95%
jan 1, 1974
3.777
+0.174
4.83%
jan 1, 1975
3.755
-0.022
-0.59%
jan 1, 1976
3.685
-0.069
-1.84%
jan 1, 1981
2.6
-1.085
-29.45%
jan 1, 1982
2.673
+0.073
2.82%
jan 1, 1983
2.874
+0.201
7.52%
jan 1, 1984
3.06
+0.186
6.49%
jan 1, 1985
3.115
+0.055
1.78%
jan 1, 1986
3.455
+0.34
10.91%
jan 1, 1987
3.473
+0.018
0.52%
jan 1, 1988
3.994
+0.521
15.0%
jan 1, 1989
4.385
+0.391
9.78%
jan 1, 1990
4.475
+0.09
2.06%
jan 1, 1991
4.658
+0.183
4.09%
jan 1, 1992
4.723
+0.065
1.39%
jan 1, 1993
4.888
+0.166
3.51%
jan 1, 1994
4.81
-0.078
-1.6%
jan 1, 1995
4.864
+0.054
1.12%
jan 1, 1996
4.981
+0.117
2.4%
jan 1, 1997
5.431
+0.45
9.03%
jan 1, 1998
5.569
+0.138
2.54%
jan 1, 1999
6.775
+1.206
21.67%
jan 1, 2000
6.659
-0.116
-1.71%
jan 1, 2001
6.894
+0.234
3.52%
jan 1, 2002
6.821
-0.073
-1.06%
jan 1, 2003
6.984
+0.164
2.4%
jan 1, 2005
6.858
-0.126
-1.81%
jan 1, 2006
6.108
-0.75
-10.94%
jan 1, 2007
7.032
+0.924
15.13%
jan 1, 2008
7.515
+0.483
6.87%
jan 1, 2009
7.796
+0.281
3.74%
jan 1, 2010
8.107
+0.311
3.99%
jan 1, 2011
8.103
-0.005
-0.06%
jan 1, 2012
8.453
+0.35
4.32%
jan 1, 2013
8.461
+0.008
0.09%
jan 1, 2014
8.881
+0.42
4.96%
jan 1, 2015
8.755
-0.125
-1.41%
Ranking of countries by current statistics by years


Comments: