29
/
en
AIzaSyAYiBZKx7MnpbEhh9jyipgxe19OcubqV5w
April 1, 2024
258762
Syrian Arab Republic
SYR
true
2
1
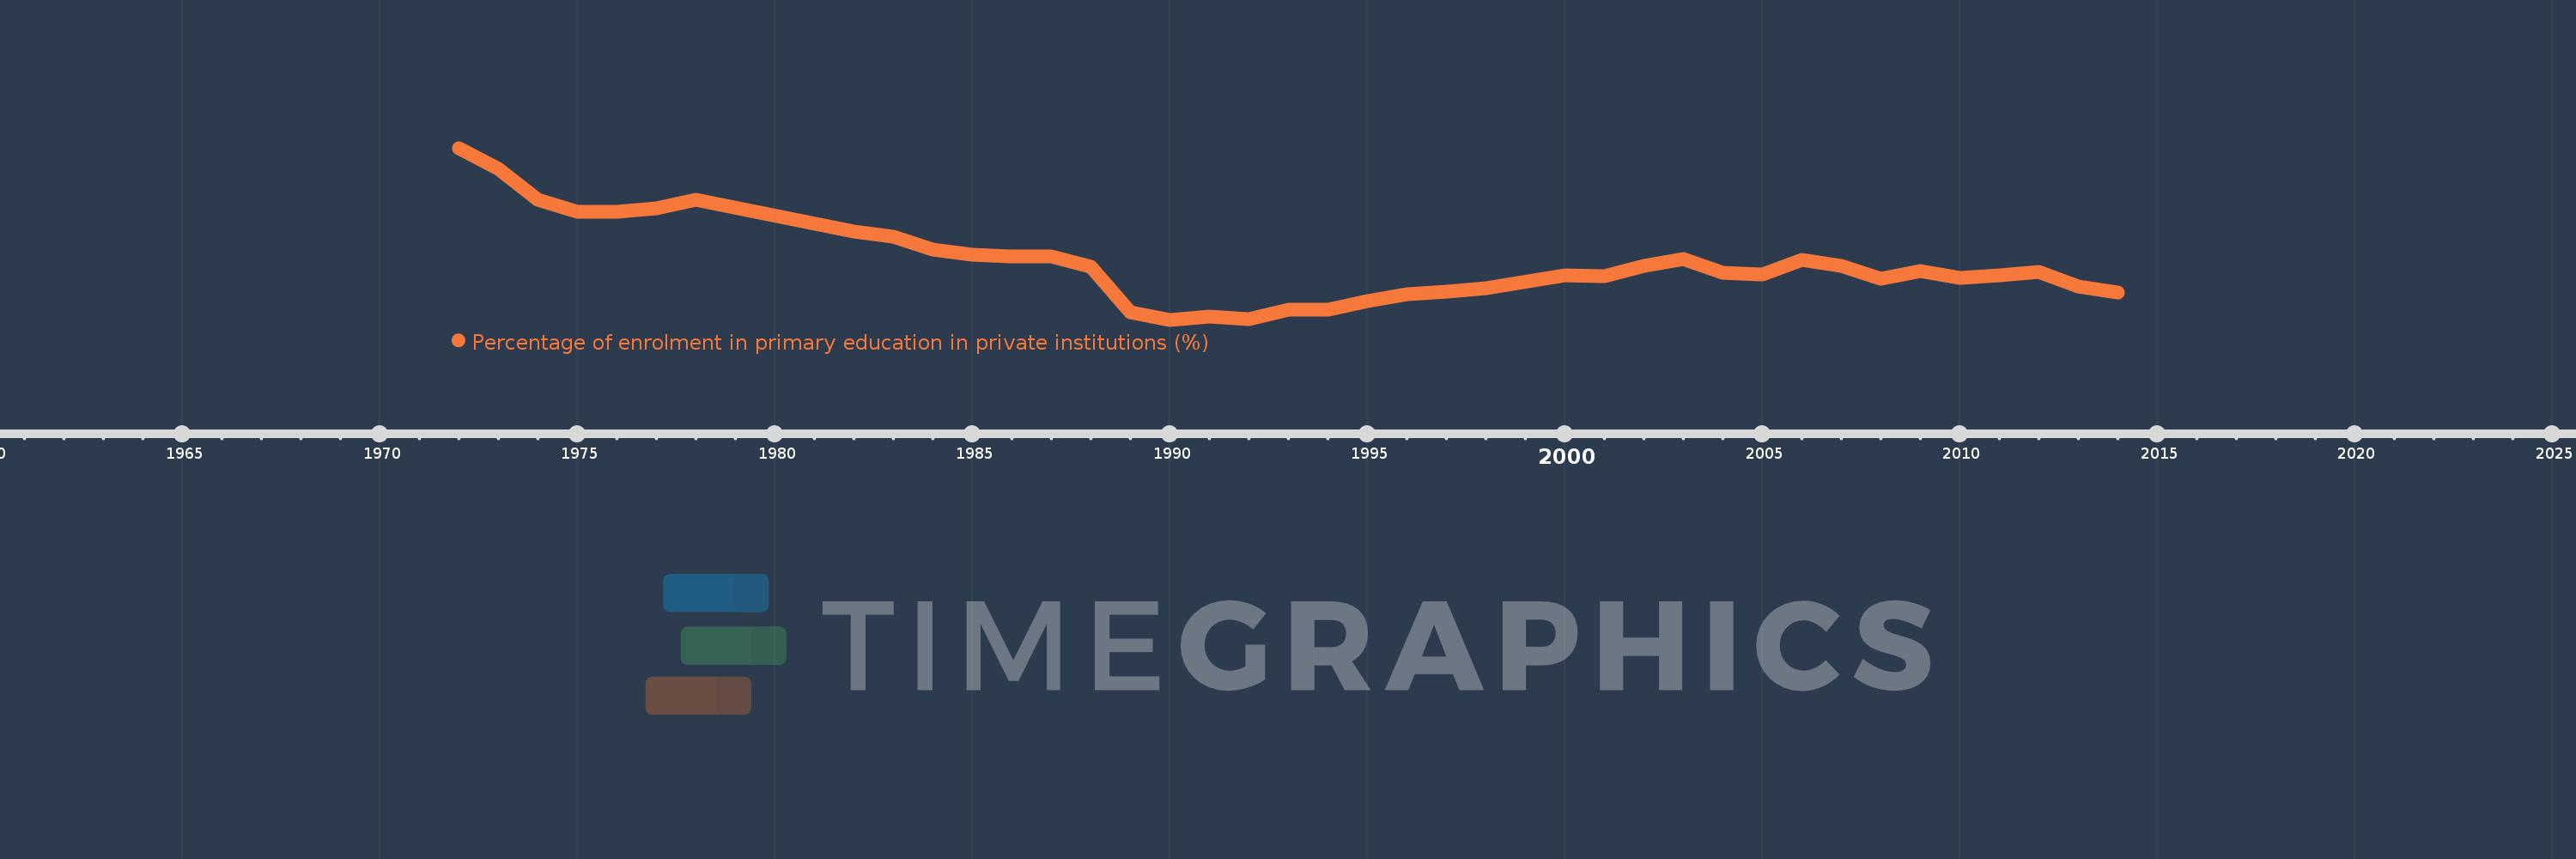
Percentage of enrolment in primary education in private institutions (%)
2014,2013,2012,2011,2010,2009,2008,2007,2006,2005,2004,2003,2002,2001,2000,1998,1997,1996,1995,1994,1993,1992,1991,1990,1989,1988,1987,1986,1985,1984,1983,1982,1978,1977,1976,1975,1974,1973,1972
This statistics in other country:
AfghanistanAlbaniaAlgeriaAndorraAngolaAntigua and BarbudaArab WorldArgentinaArmeniaArubaAustraliaAustriaAzerbaijanBahamas, TheBahrainBangladeshBarbadosBelarusBelgiumBelizeBeninBermudaBhutanBoliviaBosnia and HerzegovinaBotswanaBrazilBritish Virgin IslandsBrunei DarussalamBulgariaBurkina FasoBurundiCabo VerdeCambodiaCameroonCanadaCaribbean small statesCayman IslandsCentral African RepublicCentral Europe and the BalticsChadChileChinaColombiaComorosCongo, Dem. Rep.Congo, Rep.Costa RicaCote d'IvoireCroatiaCubaCuracaoCyprusCzech RepublicDenmarkDjiboutiDominicaDominican RepublicEarly-demographic dividendEast Asia & PacificEast Asia & Pacific (excluding high income)East Asia & Pacific (IDA & IBRD countries)EcuadorEgypt, Arab Rep.El SalvadorEquatorial GuineaEritreaEstoniaEthiopiaEuro areaEurope & Central AsiaEurope & Central Asia (excluding high income)Europe & Central Asia (IDA & IBRD countries)European UnionFijiFinlandFragile and conflict affected situationsFranceGabonGambia, TheGeorgiaGermanyGhanaGibraltarGreeceGrenadaGuatemalaGuineaGuinea-BissauGuyanaHaitiHeavily indebted poor countries (HIPC)High incomeHondurasHong Kong SAR, ChinaHungaryIBRD onlyIcelandIDA & IBRD totalIDA blendIDA onlyIDA totalIndiaIndonesiaIran, Islamic Rep.IraqIrelandIsraelItalyJamaicaJapanJordanKazakhstanKenyaKiribatiKorea, Rep.KuwaitKyrgyz RepublicLao PDRLate-demographic dividendLatin America & Caribbean Latin America & Caribbean (excluding high income)Latin America & the Caribbean (IDA & IBRD countries)LatviaLeast developed countries: UN classificationLebanonLesothoLiberiaLibyaLiechtensteinLithuaniaLow & middle incomeLow incomeLower middle incomeLuxembourgMacao SAR, ChinaMacedonia, FYRMadagascarMalawiMalaysiaMaldivesMaliMaltaMarshall IslandsMauritaniaMauritiusMexicoMiddle East & North AfricaMiddle East & North Africa (excluding high income)Middle East & North Africa (IDA & IBRD countries)Middle incomeMoldovaMonacoMongoliaMoroccoMozambiqueMyanmarNamibiaNauruNepalNetherlandsNew ZealandNicaraguaNigerNigeriaNorth AmericaNorwayOECD membersOmanOther small statesPacific island small statesPakistanPalauPanamaPapua New GuineaParaguayPeruPhilippinesPolandPortugalPost-demographic dividendPre-demographic dividendPuerto RicoQatarRomaniaRussian FederationRwandaSamoaSan MarinoSao Tome and PrincipeSaudi ArabiaSenegalSerbiaSeychellesSierra LeoneSingaporeSlovak RepublicSloveniaSmall statesSolomon IslandsSomaliaSouth AfricaSouth AsiaSouth Asia (IDA & IBRD)SpainSri LankaSt. Kitts and NevisSt. LuciaSt. Vincent and the GrenadinesSub-Saharan Africa Sub-Saharan Africa (excluding high income)Sub-Saharan Africa (IDA & IBRD countries)SudanSurinameSwazilandSwedenSwitzerlandSyrian Arab RepublicTajikistanTanzaniaThailandTimor-LesteTogoTongaTrinidad and TobagoTunisiaTurkeyTurks and Caicos IslandsTuvaluUgandaUkraineUnited Arab EmiratesUnited KingdomUnited StatesUpper middle incomeUruguayVanuatuVenezuela, RBVietnamWest Bank and GazaWorldYemen, Rep.ZambiaZimbabwe Timeline:
This timeline shows a graph from 1972 to 2014 of Syrian Arab Republic. No data until 1971. Number of actual observations by date: 39.
Source name:
World Development Indicators
Source organization:
UNESCO Institute for Statistics
Categories, topics:
Education
Last updated:
apr 23, 2017
Indicators value changes by year
At the date of observation
Value
Absolute change
Change from previous value
jan 1, 1972
6.056
+6.056
0.0%
jan 1, 1973
5.746
-0.309
-5.1%
jan 1, 1974
5.302
-0.444
-7.73%
jan 1, 1975
5.125
-0.178
-3.35%
jan 1, 1976
5.117
-0.008
-0.16%
jan 1, 1977
5.167
+0.05
0.97%
jan 1, 1978
5.295
+0.129
2.49%
jan 1, 1982
4.831
-0.464
-8.77%
jan 1, 1983
4.757
-0.074
-1.54%
jan 1, 1984
4.569
-0.187
-3.94%
jan 1, 1985
4.496
-0.074
-1.61%
jan 1, 1986
4.468
-0.028
-0.63%
jan 1, 1987
4.466
-0.001
-0.02%
jan 1, 1988
4.315
-0.152
-3.4%
jan 1, 1989
3.651
-0.664
-15.39%
jan 1, 1990
3.542
-0.109
-2.99%
jan 1, 1991
3.584
+0.042
1.19%
jan 1, 1992
3.545
-0.039
-1.08%
jan 1, 1993
3.684
+0.139
3.91%
jan 1, 1994
3.69
+0.006
0.16%
jan 1, 1995
3.816
+0.126
3.42%
jan 1, 1996
3.912
+0.096
2.53%
jan 1, 1997
3.948
+0.035
0.91%
jan 1, 1998
4.008
+0.06
1.52%
jan 1, 2000
4.19
+0.182
4.54%
jan 1, 2001
4.18
-0.009
-0.22%
jan 1, 2002
4.327
+0.147
3.51%
jan 1, 2003
4.429
+0.102
2.35%
jan 1, 2004
4.224
-0.204
-4.62%
jan 1, 2005
4.21
-0.014
-0.33%
jan 1, 2006
4.424
+0.214
5.08%
jan 1, 2007
4.326
-0.098
-2.21%
jan 1, 2008
4.145
-0.181
-4.17%
jan 1, 2009
4.26
+0.115
2.77%
jan 1, 2010
4.153
-0.107
-2.51%
jan 1, 2011
4.192
+0.039
0.93%
jan 1, 2012
4.248
+0.057
1.35%
jan 1, 2013
4.023
-0.225
-5.3%
jan 1, 2014
3.937
-0.086
-2.14%
Ranking of countries by current statistics by years


Comments: