29
/
en
AIzaSyAYiBZKx7MnpbEhh9jyipgxe19OcubqV5w
April 1, 2024
236233
Senegal
SEN
true
2
1
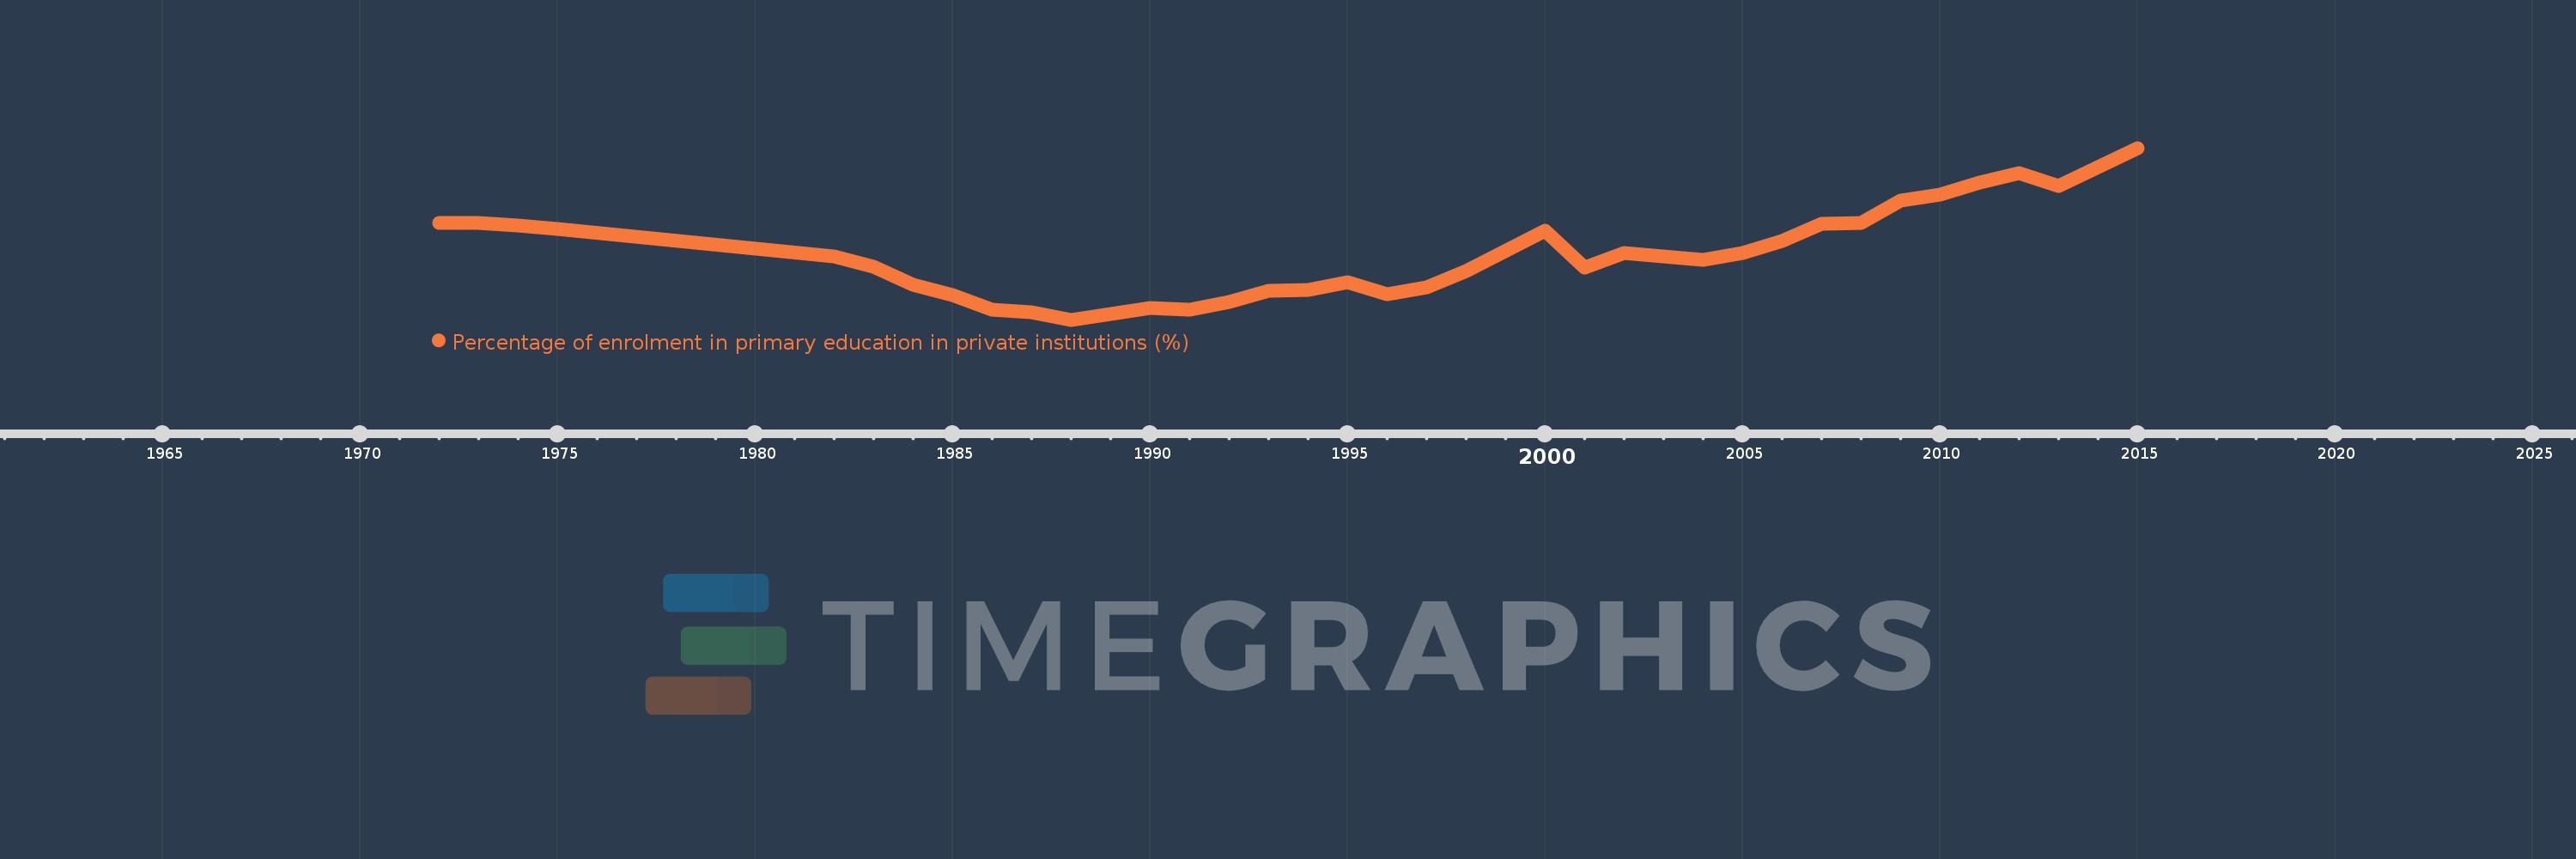
Percentage of enrolment in primary education in private institutions (%)
2015,2013,2012,2011,2010,2009,2008,2007,2006,2005,2004,2003,2002,2001,2000,1998,1997,1996,1995,1994,1993,1992,1991,1990,1989,1988,1987,1986,1985,1984,1983,1982,1975,1974,1973,1972
This statistics in other country:
AfghanistanAlbaniaAlgeriaAndorraAngolaAntigua and BarbudaArab WorldArgentinaArmeniaArubaAustraliaAustriaAzerbaijanBahamas, TheBahrainBangladeshBarbadosBelarusBelgiumBelizeBeninBermudaBhutanBoliviaBosnia and HerzegovinaBotswanaBrazilBritish Virgin IslandsBrunei DarussalamBulgariaBurkina FasoBurundiCabo VerdeCambodiaCameroonCanadaCaribbean small statesCayman IslandsCentral African RepublicCentral Europe and the BalticsChadChileChinaColombiaComorosCongo, Dem. Rep.Congo, Rep.Costa RicaCote d'IvoireCroatiaCubaCuracaoCyprusCzech RepublicDenmarkDjiboutiDominicaDominican RepublicEarly-demographic dividendEast Asia & PacificEast Asia & Pacific (excluding high income)East Asia & Pacific (IDA & IBRD countries)EcuadorEgypt, Arab Rep.El SalvadorEquatorial GuineaEritreaEstoniaEthiopiaEuro areaEurope & Central AsiaEurope & Central Asia (excluding high income)Europe & Central Asia (IDA & IBRD countries)European UnionFijiFinlandFragile and conflict affected situationsFranceGabonGambia, TheGeorgiaGermanyGhanaGibraltarGreeceGrenadaGuatemalaGuineaGuinea-BissauGuyanaHaitiHeavily indebted poor countries (HIPC)High incomeHondurasHong Kong SAR, ChinaHungaryIBRD onlyIcelandIDA & IBRD totalIDA blendIDA onlyIDA totalIndiaIndonesiaIran, Islamic Rep.IraqIrelandIsraelItalyJamaicaJapanJordanKazakhstanKenyaKiribatiKorea, Rep.KuwaitKyrgyz RepublicLao PDRLate-demographic dividendLatin America & Caribbean Latin America & Caribbean (excluding high income)Latin America & the Caribbean (IDA & IBRD countries)LatviaLeast developed countries: UN classificationLebanonLesothoLiberiaLibyaLiechtensteinLithuaniaLow & middle incomeLow incomeLower middle incomeLuxembourgMacao SAR, ChinaMacedonia, FYRMadagascarMalawiMalaysiaMaldivesMaliMaltaMarshall IslandsMauritaniaMauritiusMexicoMiddle East & North AfricaMiddle East & North Africa (excluding high income)Middle East & North Africa (IDA & IBRD countries)Middle incomeMoldovaMonacoMongoliaMoroccoMozambiqueMyanmarNamibiaNauruNepalNetherlandsNew ZealandNicaraguaNigerNigeriaNorth AmericaNorwayOECD membersOmanOther small statesPacific island small statesPakistanPalauPanamaPapua New GuineaParaguayPeruPhilippinesPolandPortugalPost-demographic dividendPre-demographic dividendPuerto RicoQatarRomaniaRussian FederationRwandaSamoaSan MarinoSao Tome and PrincipeSaudi ArabiaSenegalSerbiaSeychellesSierra LeoneSingaporeSlovak RepublicSloveniaSmall statesSolomon IslandsSomaliaSouth AfricaSouth AsiaSouth Asia (IDA & IBRD)SpainSri LankaSt. Kitts and NevisSt. LuciaSt. Vincent and the GrenadinesSub-Saharan Africa Sub-Saharan Africa (excluding high income)Sub-Saharan Africa (IDA & IBRD countries)SudanSurinameSwazilandSwedenSwitzerlandSyrian Arab RepublicTajikistanTanzaniaThailandTimor-LesteTogoTongaTrinidad and TobagoTunisiaTurkeyTurks and Caicos IslandsTuvaluUgandaUkraineUnited Arab EmiratesUnited KingdomUnited StatesUpper middle incomeUruguayVanuatuVenezuela, RBVietnamWest Bank and GazaWorldYemen, Rep.ZambiaZimbabwe Timeline:
This timeline shows a graph from 1972 to 2015 of Senegal. No data until 1971. Number of actual observations by date: 36.
Source name:
World Development Indicators
Source organization:
UNESCO Institute for Statistics
Categories, topics:
Education
Last updated:
apr 23, 2017
Indicators value changes by year
At the date of observation
Value
Absolute change
Change from previous value
jan 1, 1972
12.379
+12.379
0.0%
jan 1, 1973
12.378
-0.001
-0.01%
jan 1, 1974
12.271
-0.108
-0.87%
jan 1, 1975
12.123
-0.148
-1.21%
jan 1, 1982
11.034
-1.088
-8.98%
jan 1, 1983
10.625
-0.409
-3.71%
jan 1, 1984
9.886
-0.739
-6.96%
jan 1, 1985
9.483
-0.403
-4.07%
jan 1, 1986
8.895
-0.588
-6.2%
jan 1, 1987
8.793
-0.101
-1.14%
jan 1, 1988
8.484
-0.31
-3.52%
jan 1, 1989
8.728
+0.244
2.88%
jan 1, 1990
8.947
+0.22
2.52%
jan 1, 1991
8.888
-0.06
-0.67%
jan 1, 1992
9.199
+0.311
3.5%
jan 1, 1993
9.64
+0.441
4.8%
jan 1, 1994
9.695
+0.055
0.57%
jan 1, 1995
9.984
+0.289
2.98%
jan 1, 1996
9.519
-0.465
-4.65%
jan 1, 1997
9.791
+0.271
2.85%
jan 1, 1998
10.451
+0.66
6.74%
jan 1, 2000
12.069
+1.618
15.48%
jan 1, 2001
10.591
-1.478
-12.25%
jan 1, 2002
11.163
+0.572
5.4%
jan 1, 2003
11.03
-0.133
-1.19%
jan 1, 2004
10.899
-0.131
-1.19%
jan 1, 2005
11.167
+0.268
2.46%
jan 1, 2006
11.648
+0.481
4.31%
jan 1, 2007
12.357
+0.709
6.09%
jan 1, 2008
12.381
+0.023
0.19%
jan 1, 2009
13.274
+0.893
7.21%
jan 1, 2010
13.52
+0.246
1.86%
jan 1, 2011
13.988
+0.468
3.46%
jan 1, 2012
14.378
+0.39
2.79%
jan 1, 2013
13.857
-0.52
-3.62%
jan 1, 2015
15.39
+1.532
11.06%
Ranking of countries by current statistics by years


Comments: