29
/
en
AIzaSyAYiBZKx7MnpbEhh9jyipgxe19OcubqV5w
April 1, 2024
46458
Low income
LIC
false
2
1
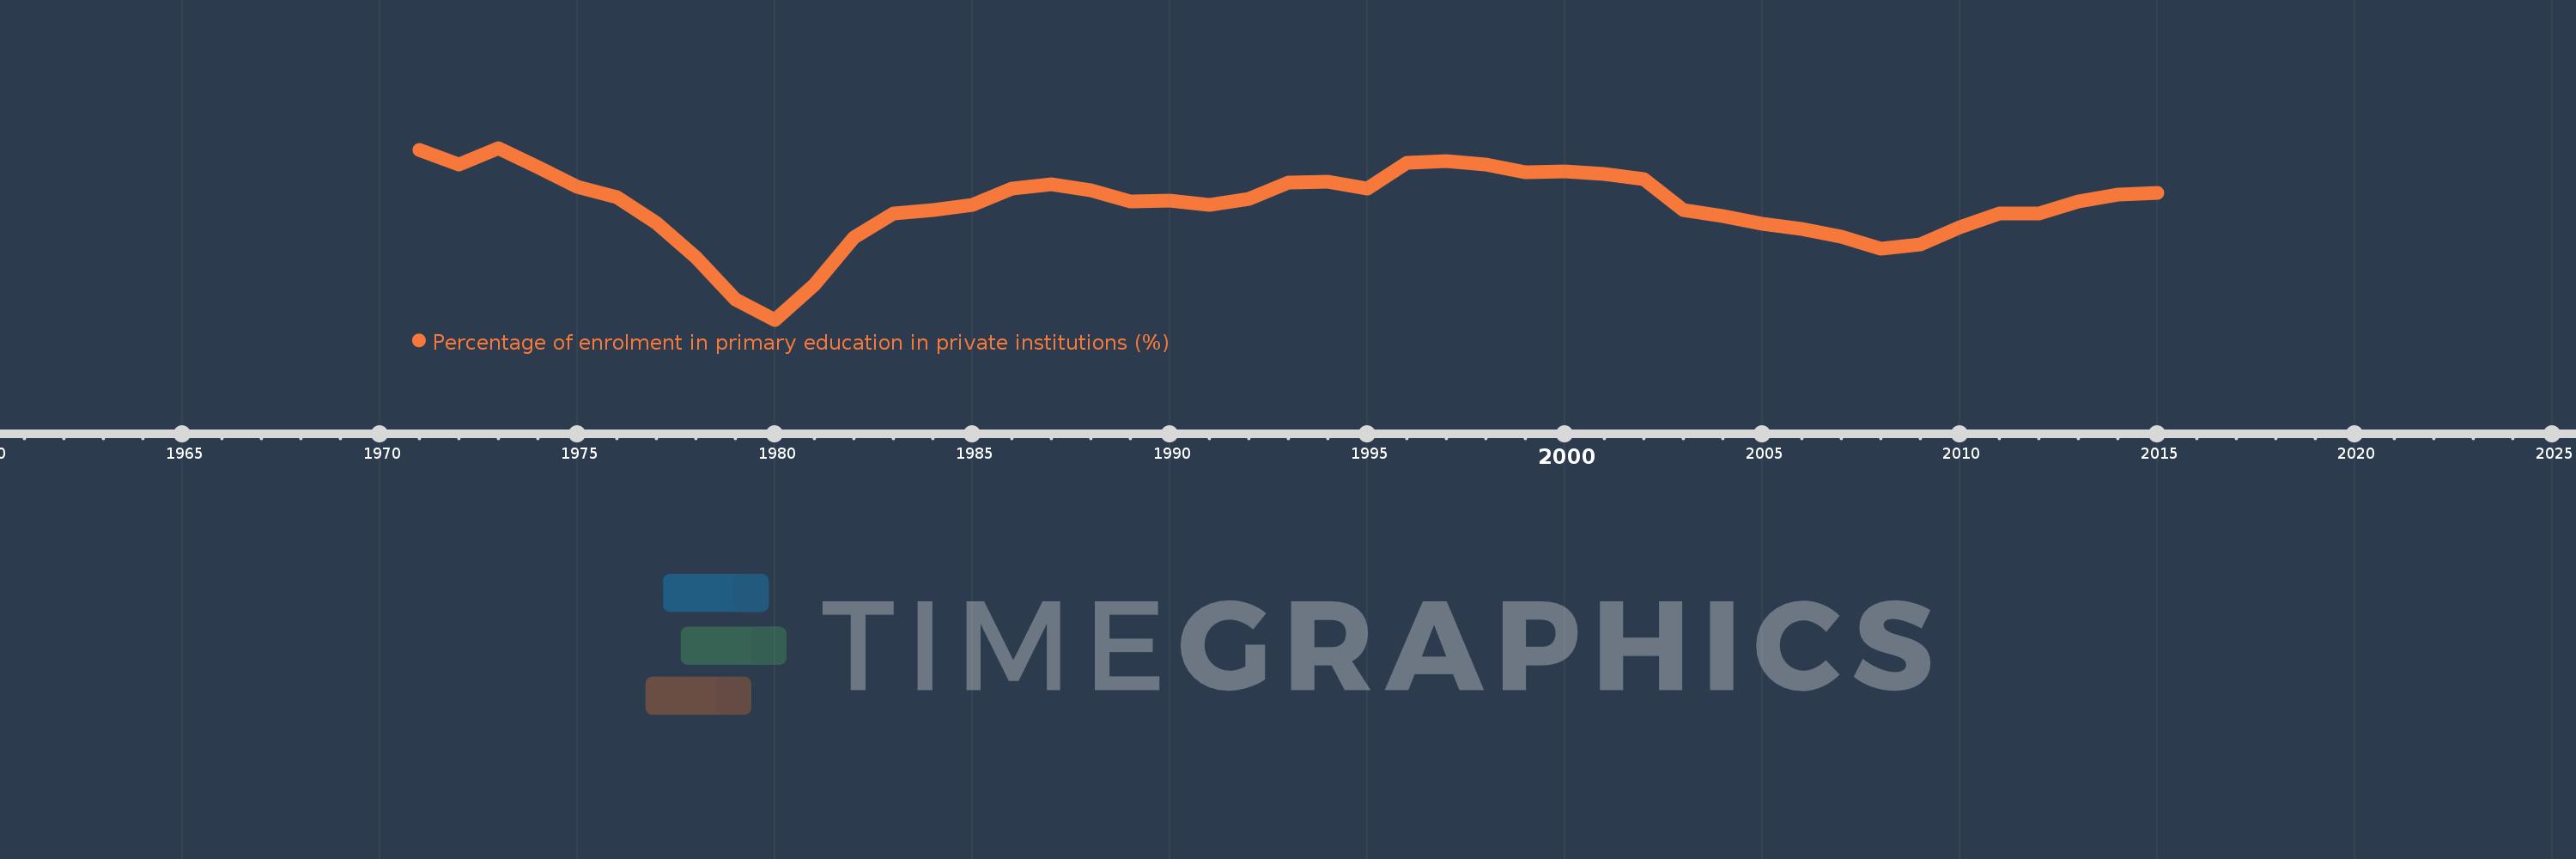
Percentage of enrolment in primary education in private institutions (%)
2015,2014,2013,2012,2011,2010,2009,2008,2007,2006,2005,2004,2003,2002,2001,2000,1999,1998,1997,1996,1995,1994,1993,1992,1991,1990,1989,1988,1987,1986,1985,1984,1983,1982,1981,1980,1979,1978,1977,1976,1975,1974,1973,1972,1971
This statistics in other country:
AfghanistanAlbaniaAlgeriaAndorraAngolaAntigua and BarbudaArab WorldArgentinaArmeniaArubaAustraliaAustriaAzerbaijanBahamas, TheBahrainBangladeshBarbadosBelarusBelgiumBelizeBeninBermudaBhutanBoliviaBosnia and HerzegovinaBotswanaBrazilBritish Virgin IslandsBrunei DarussalamBulgariaBurkina FasoBurundiCabo VerdeCambodiaCameroonCanadaCaribbean small statesCayman IslandsCentral African RepublicCentral Europe and the BalticsChadChileChinaColombiaComorosCongo, Dem. Rep.Congo, Rep.Costa RicaCote d'IvoireCroatiaCubaCuracaoCyprusCzech RepublicDenmarkDjiboutiDominicaDominican RepublicEarly-demographic dividendEast Asia & PacificEast Asia & Pacific (excluding high income)East Asia & Pacific (IDA & IBRD countries)EcuadorEgypt, Arab Rep.El SalvadorEquatorial GuineaEritreaEstoniaEthiopiaEuro areaEurope & Central AsiaEurope & Central Asia (excluding high income)Europe & Central Asia (IDA & IBRD countries)European UnionFijiFinlandFragile and conflict affected situationsFranceGabonGambia, TheGeorgiaGermanyGhanaGibraltarGreeceGrenadaGuatemalaGuineaGuinea-BissauGuyanaHaitiHeavily indebted poor countries (HIPC)High incomeHondurasHong Kong SAR, ChinaHungaryIBRD onlyIcelandIDA & IBRD totalIDA blendIDA onlyIDA totalIndiaIndonesiaIran, Islamic Rep.IraqIrelandIsraelItalyJamaicaJapanJordanKazakhstanKenyaKiribatiKorea, Rep.KuwaitKyrgyz RepublicLao PDRLate-demographic dividendLatin America & Caribbean Latin America & Caribbean (excluding high income)Latin America & the Caribbean (IDA & IBRD countries)LatviaLeast developed countries: UN classificationLebanonLesothoLiberiaLibyaLiechtensteinLithuaniaLow & middle incomeLow incomeLower middle incomeLuxembourgMacao SAR, ChinaMacedonia, FYRMadagascarMalawiMalaysiaMaldivesMaliMaltaMarshall IslandsMauritaniaMauritiusMexicoMiddle East & North AfricaMiddle East & North Africa (excluding high income)Middle East & North Africa (IDA & IBRD countries)Middle incomeMoldovaMonacoMongoliaMoroccoMozambiqueMyanmarNamibiaNauruNepalNetherlandsNew ZealandNicaraguaNigerNigeriaNorth AmericaNorwayOECD membersOmanOther small statesPacific island small statesPakistanPalauPanamaPapua New GuineaParaguayPeruPhilippinesPolandPortugalPost-demographic dividendPre-demographic dividendPuerto RicoQatarRomaniaRussian FederationRwandaSamoaSan MarinoSao Tome and PrincipeSaudi ArabiaSenegalSerbiaSeychellesSierra LeoneSingaporeSlovak RepublicSloveniaSmall statesSolomon IslandsSomaliaSouth AfricaSouth AsiaSouth Asia (IDA & IBRD)SpainSri LankaSt. Kitts and NevisSt. LuciaSt. Vincent and the GrenadinesSub-Saharan Africa Sub-Saharan Africa (excluding high income)Sub-Saharan Africa (IDA & IBRD countries)SudanSurinameSwazilandSwedenSwitzerlandSyrian Arab RepublicTajikistanTanzaniaThailandTimor-LesteTogoTongaTrinidad and TobagoTunisiaTurkeyTurks and Caicos IslandsTuvaluUgandaUkraineUnited Arab EmiratesUnited KingdomUnited StatesUpper middle incomeUruguayVanuatuVenezuela, RBVietnamWest Bank and GazaWorldYemen, Rep.ZambiaZimbabwe Timeline:
This timeline shows a graph from 1971 to 2015 of Low income. No data until 1970. Number of actual observations by date: 45.
Source name:
World Development Indicators
Source organization:
UNESCO Institute for Statistics
Categories, topics:
Education
Last updated:
apr 23, 2017
Indicators value changes by year
Minimum:
10.329
jan 1, 1980
Maximum:
14.707
jan 1, 1973
At the date of observation
Value
Absolute change
Change from previous value
jan 1, 1971
14.663
+14.663
0.0%
jan 1, 1972
14.29
-0.373
-2.54%
jan 1, 1973
14.707
+0.417
2.92%
jan 1, 1974
14.208
-0.5
-3.4%
jan 1, 1975
13.723
-0.485
-3.41%
jan 1, 1976
13.455
-0.268
-1.95%
jan 1, 1977
12.805
-0.65
-4.83%
jan 1, 1978
11.916
-0.889
-6.94%
jan 1, 1979
10.844
-1.072
-9.0%
jan 1, 1980
10.329
-0.515
-4.75%
jan 1, 1981
11.228
+0.899
8.7%
jan 1, 1982
12.43
+1.202
10.71%
jan 1, 1983
13.033
+0.603
4.85%
jan 1, 1984
13.133
+0.099
0.76%
jan 1, 1985
13.266
+0.133
1.01%
jan 1, 1986
13.682
+0.417
3.14%
jan 1, 1987
13.781
+0.099
0.72%
jan 1, 1988
13.62
-0.161
-1.17%
jan 1, 1989
13.341
-0.278
-2.04%
jan 1, 1990
13.373
+0.031
0.24%
jan 1, 1991
13.262
-0.111
-0.83%
jan 1, 1992
13.398
+0.136
1.03%
jan 1, 1993
13.834
+0.436
3.25%
jan 1, 1994
13.844
+0.01
0.07%
jan 1, 1995
13.673
-0.171
-1.24%
jan 1, 1996
14.334
+0.662
4.84%
jan 1, 1997
14.38
+0.046
0.32%
jan 1, 1998
14.279
-0.102
-0.71%
jan 1, 1999
14.085
-0.194
-1.36%
jan 1, 2000
14.114
+0.029
0.21%
jan 1, 2001
14.035
-0.079
-0.56%
jan 1, 2002
13.902
-0.134
-0.95%
jan 1, 2003
13.127
-0.774
-5.57%
jan 1, 2004
12.974
-0.153
-1.17%
jan 1, 2005
12.773
-0.201
-1.55%
jan 1, 2006
12.65
-0.124
-0.97%
jan 1, 2007
12.436
-0.214
-1.69%
jan 1, 2008
12.141
-0.295
-2.37%
jan 1, 2009
12.24
+0.099
0.82%
jan 1, 2010
12.695
+0.454
3.71%
jan 1, 2011
13.041
+0.347
2.73%
jan 1, 2012
13.029
-0.012
-0.09%
jan 1, 2013
13.336
+0.307
2.36%
jan 1, 2014
13.529
+0.193
1.45%
jan 1, 2015
13.564
+0.035
0.26%
Ranking of countries by current statistics by years


Comments: