29
/
en
AIzaSyAYiBZKx7MnpbEhh9jyipgxe19OcubqV5w
April 1, 2024
202041
Morocco
MAR
true
2
1
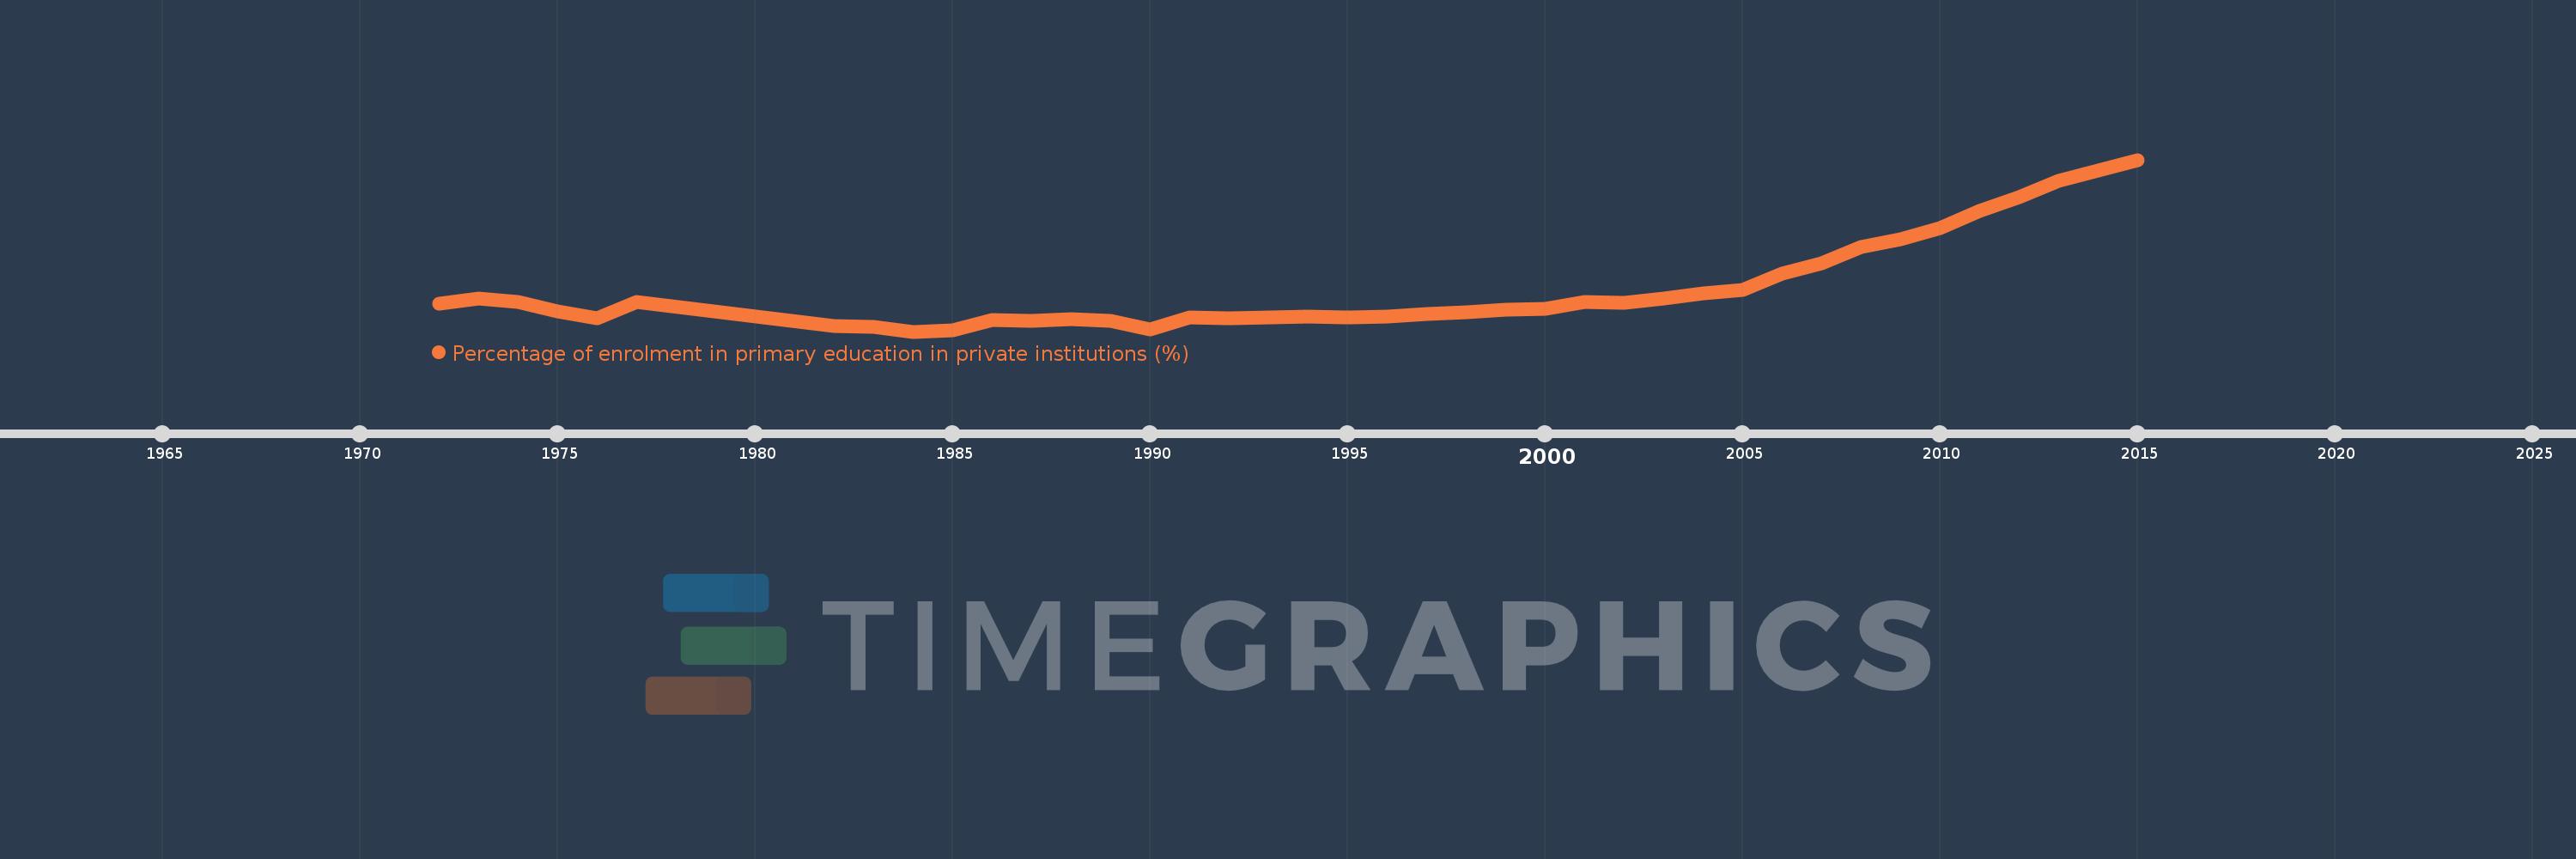
Percentage of enrolment in primary education in private institutions (%)
2015,2014,2013,2012,2011,2010,2009,2008,2007,2006,2005,2004,2003,2002,2001,2000,1999,1998,1997,1996,1995,1994,1993,1992,1991,1990,1989,1988,1987,1986,1985,1984,1983,1982,1977,1976,1975,1974,1973,1972
This statistics in other country:
AfghanistanAlbaniaAlgeriaAndorraAngolaAntigua and BarbudaArab WorldArgentinaArmeniaArubaAustraliaAustriaAzerbaijanBahamas, TheBahrainBangladeshBarbadosBelarusBelgiumBelizeBeninBermudaBhutanBoliviaBosnia and HerzegovinaBotswanaBrazilBritish Virgin IslandsBrunei DarussalamBulgariaBurkina FasoBurundiCabo VerdeCambodiaCameroonCanadaCaribbean small statesCayman IslandsCentral African RepublicCentral Europe and the BalticsChadChileChinaColombiaComorosCongo, Dem. Rep.Congo, Rep.Costa RicaCote d'IvoireCroatiaCubaCuracaoCyprusCzech RepublicDenmarkDjiboutiDominicaDominican RepublicEarly-demographic dividendEast Asia & PacificEast Asia & Pacific (excluding high income)East Asia & Pacific (IDA & IBRD countries)EcuadorEgypt, Arab Rep.El SalvadorEquatorial GuineaEritreaEstoniaEthiopiaEuro areaEurope & Central AsiaEurope & Central Asia (excluding high income)Europe & Central Asia (IDA & IBRD countries)European UnionFijiFinlandFragile and conflict affected situationsFranceGabonGambia, TheGeorgiaGermanyGhanaGibraltarGreeceGrenadaGuatemalaGuineaGuinea-BissauGuyanaHaitiHeavily indebted poor countries (HIPC)High incomeHondurasHong Kong SAR, ChinaHungaryIBRD onlyIcelandIDA & IBRD totalIDA blendIDA onlyIDA totalIndiaIndonesiaIran, Islamic Rep.IraqIrelandIsraelItalyJamaicaJapanJordanKazakhstanKenyaKiribatiKorea, Rep.KuwaitKyrgyz RepublicLao PDRLate-demographic dividendLatin America & Caribbean Latin America & Caribbean (excluding high income)Latin America & the Caribbean (IDA & IBRD countries)LatviaLeast developed countries: UN classificationLebanonLesothoLiberiaLibyaLiechtensteinLithuaniaLow & middle incomeLow incomeLower middle incomeLuxembourgMacao SAR, ChinaMacedonia, FYRMadagascarMalawiMalaysiaMaldivesMaliMaltaMarshall IslandsMauritaniaMauritiusMexicoMiddle East & North AfricaMiddle East & North Africa (excluding high income)Middle East & North Africa (IDA & IBRD countries)Middle incomeMoldovaMonacoMongoliaMoroccoMozambiqueMyanmarNamibiaNauruNepalNetherlandsNew ZealandNicaraguaNigerNigeriaNorth AmericaNorwayOECD membersOmanOther small statesPacific island small statesPakistanPalauPanamaPapua New GuineaParaguayPeruPhilippinesPolandPortugalPost-demographic dividendPre-demographic dividendPuerto RicoQatarRomaniaRussian FederationRwandaSamoaSan MarinoSao Tome and PrincipeSaudi ArabiaSenegalSerbiaSeychellesSierra LeoneSingaporeSlovak RepublicSloveniaSmall statesSolomon IslandsSomaliaSouth AfricaSouth AsiaSouth Asia (IDA & IBRD)SpainSri LankaSt. Kitts and NevisSt. LuciaSt. Vincent and the GrenadinesSub-Saharan Africa Sub-Saharan Africa (excluding high income)Sub-Saharan Africa (IDA & IBRD countries)SudanSurinameSwazilandSwedenSwitzerlandSyrian Arab RepublicTajikistanTanzaniaThailandTimor-LesteTogoTongaTrinidad and TobagoTunisiaTurkeyTurks and Caicos IslandsTuvaluUgandaUkraineUnited Arab EmiratesUnited KingdomUnited StatesUpper middle incomeUruguayVanuatuVenezuela, RBVietnamWest Bank and GazaWorldYemen, Rep.ZambiaZimbabwe Timeline:
This timeline shows a graph from 1972 to 2015 of Morocco. No data until 1971. Number of actual observations by date: 40.
Source name:
World Development Indicators
Source organization:
UNESCO Institute for Statistics
Categories, topics:
Education
Last updated:
apr 23, 2017
Indicators value changes by year
Maximum:
14.289
jan 1, 2015
At the date of observation
Value
Absolute change
Change from previous value
jan 1, 1972
4.536
+4.536
0.0%
jan 1, 1973
4.921
+0.386
8.5%
jan 1, 1974
4.691
-0.23
-4.68%
jan 1, 1975
4.055
-0.636
-13.56%
jan 1, 1976
3.544
-0.511
-12.59%
jan 1, 1977
4.694
+1.149
32.43%
jan 1, 1982
3.047
-1.647
-35.08%
jan 1, 1983
2.993
-0.054
-1.76%
jan 1, 1984
2.667
-0.326
-10.89%
jan 1, 1985
2.777
+0.109
4.09%
jan 1, 1986
3.441
+0.664
23.92%
jan 1, 1987
3.375
-0.066
-1.91%
jan 1, 1988
3.525
+0.15
4.44%
jan 1, 1989
3.413
-0.112
-3.18%
jan 1, 1990
2.805
-0.608
-17.81%
jan 1, 1991
3.609
+0.805
28.68%
jan 1, 1992
3.586
-0.023
-0.64%
jan 1, 1993
3.627
+0.041
1.14%
jan 1, 1994
3.673
+0.046
1.27%
jan 1, 1995
3.638
-0.035
-0.96%
jan 1, 1996
3.688
+0.05
1.38%
jan 1, 1997
3.832
+0.144
3.9%
jan 1, 1998
4.002
+0.17
4.43%
jan 1, 1999
4.158
+0.156
3.91%
jan 1, 2000
4.182
+0.024
0.57%
jan 1, 2001
4.678
+0.496
11.86%
jan 1, 2002
4.622
-0.056
-1.2%
jan 1, 2003
4.883
+0.261
5.64%
jan 1, 2004
5.279
+0.396
8.11%
jan 1, 2005
5.485
+0.205
3.89%
jan 1, 2006
6.58
+1.095
19.96%
jan 1, 2007
7.263
+0.683
10.38%
jan 1, 2008
8.374
+1.112
15.3%
jan 1, 2009
8.936
+0.561
6.7%
jan 1, 2010
9.648
+0.712
7.97%
jan 1, 2011
10.809
+1.162
12.04%
jan 1, 2012
11.768
+0.958
8.86%
jan 1, 2013
12.85
+1.083
9.2%
jan 1, 2014
13.575
+0.725
5.64%
jan 1, 2015
14.289
+0.714
5.26%
Ranking of countries by current statistics by years


Comments: