30
/
AIzaSyAYiBZKx7MnpbEhh9jyipgxe19OcubqV5w
April 1, 2024
269811
Turkey
TUR
true
2
1
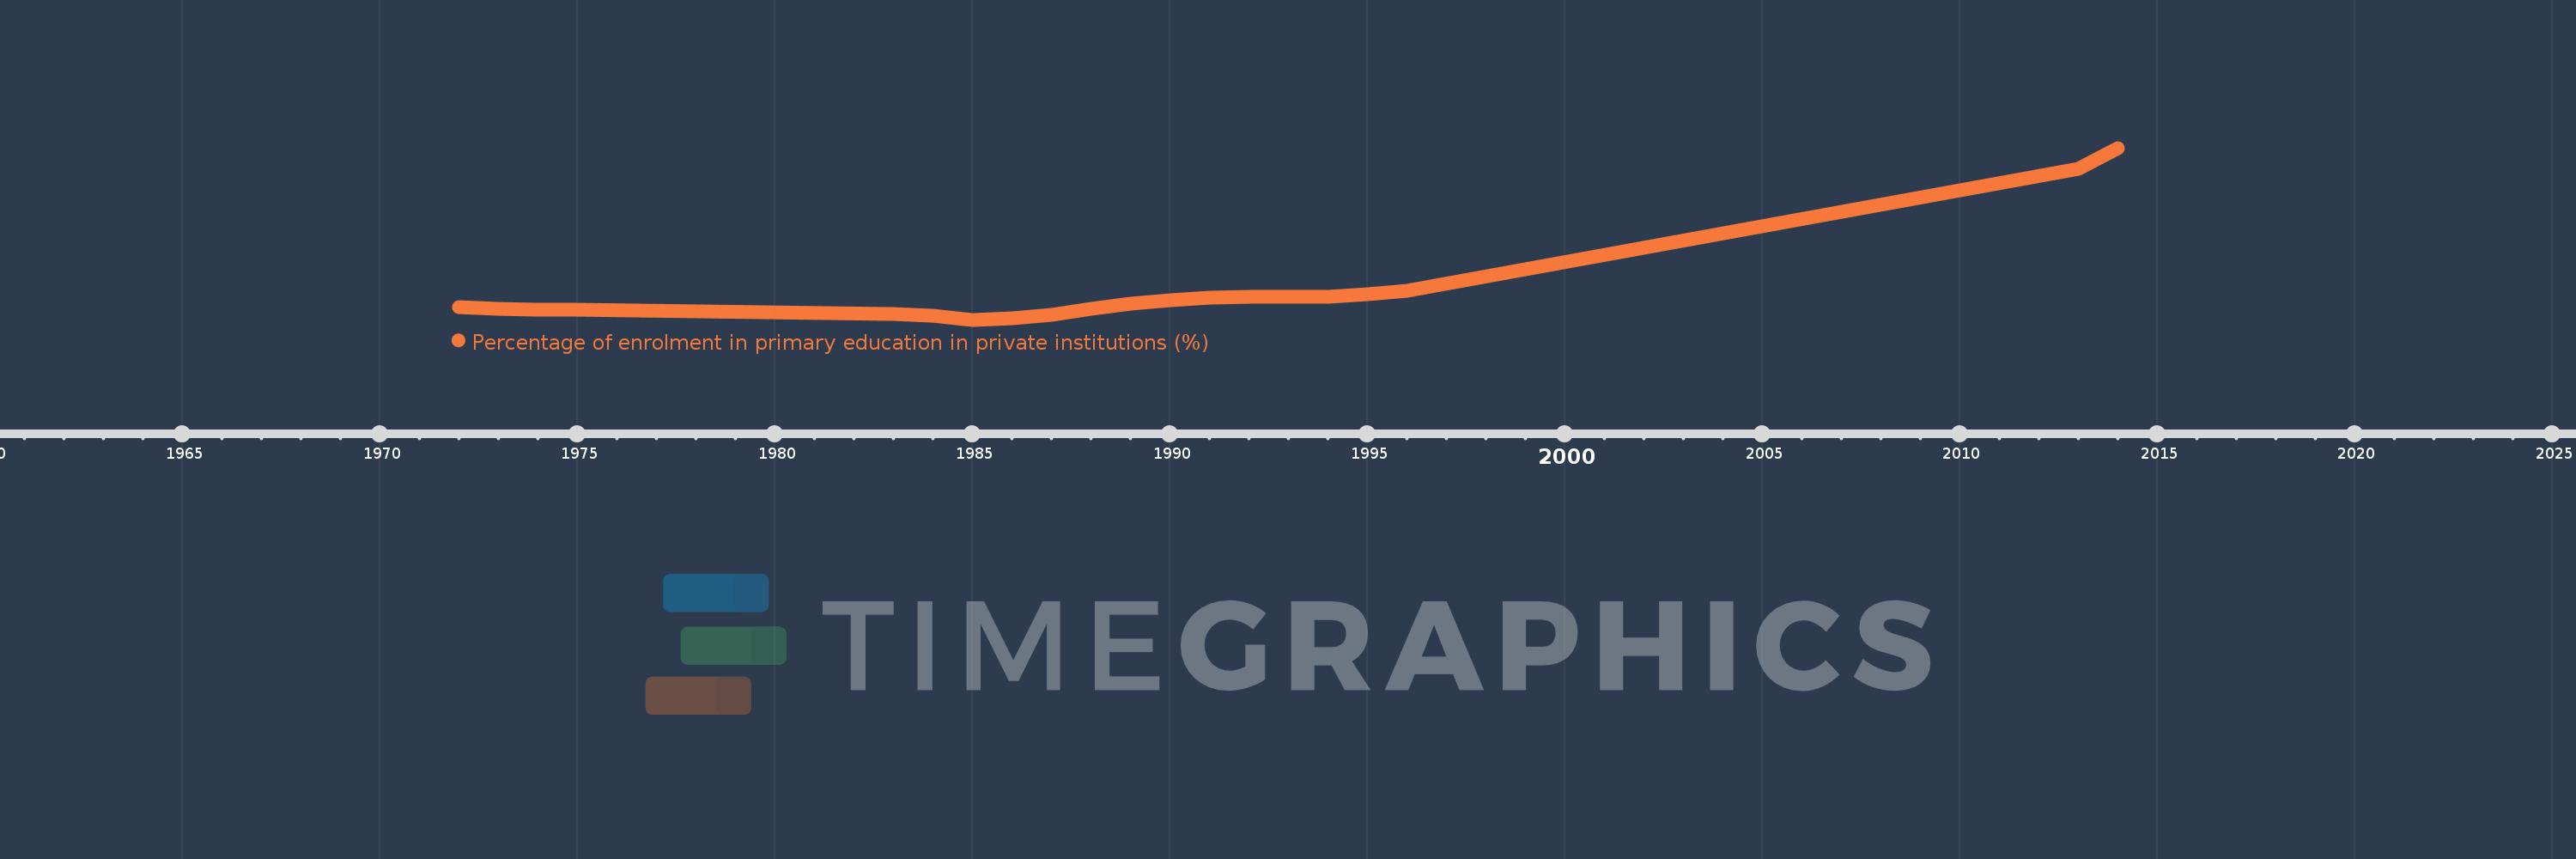
Percentage of enrolment in primary education in private institutions (%)
2014,2013,1996,1995,1994,1993,1992,1991,1990,1989,1988,1987,1986,1985,1984,1983,1975,1974,1973,1972
