29
/
en
AIzaSyAYiBZKx7MnpbEhh9jyipgxe19OcubqV5w
April 1, 2024
214674
Norway
NOR
true
2
1
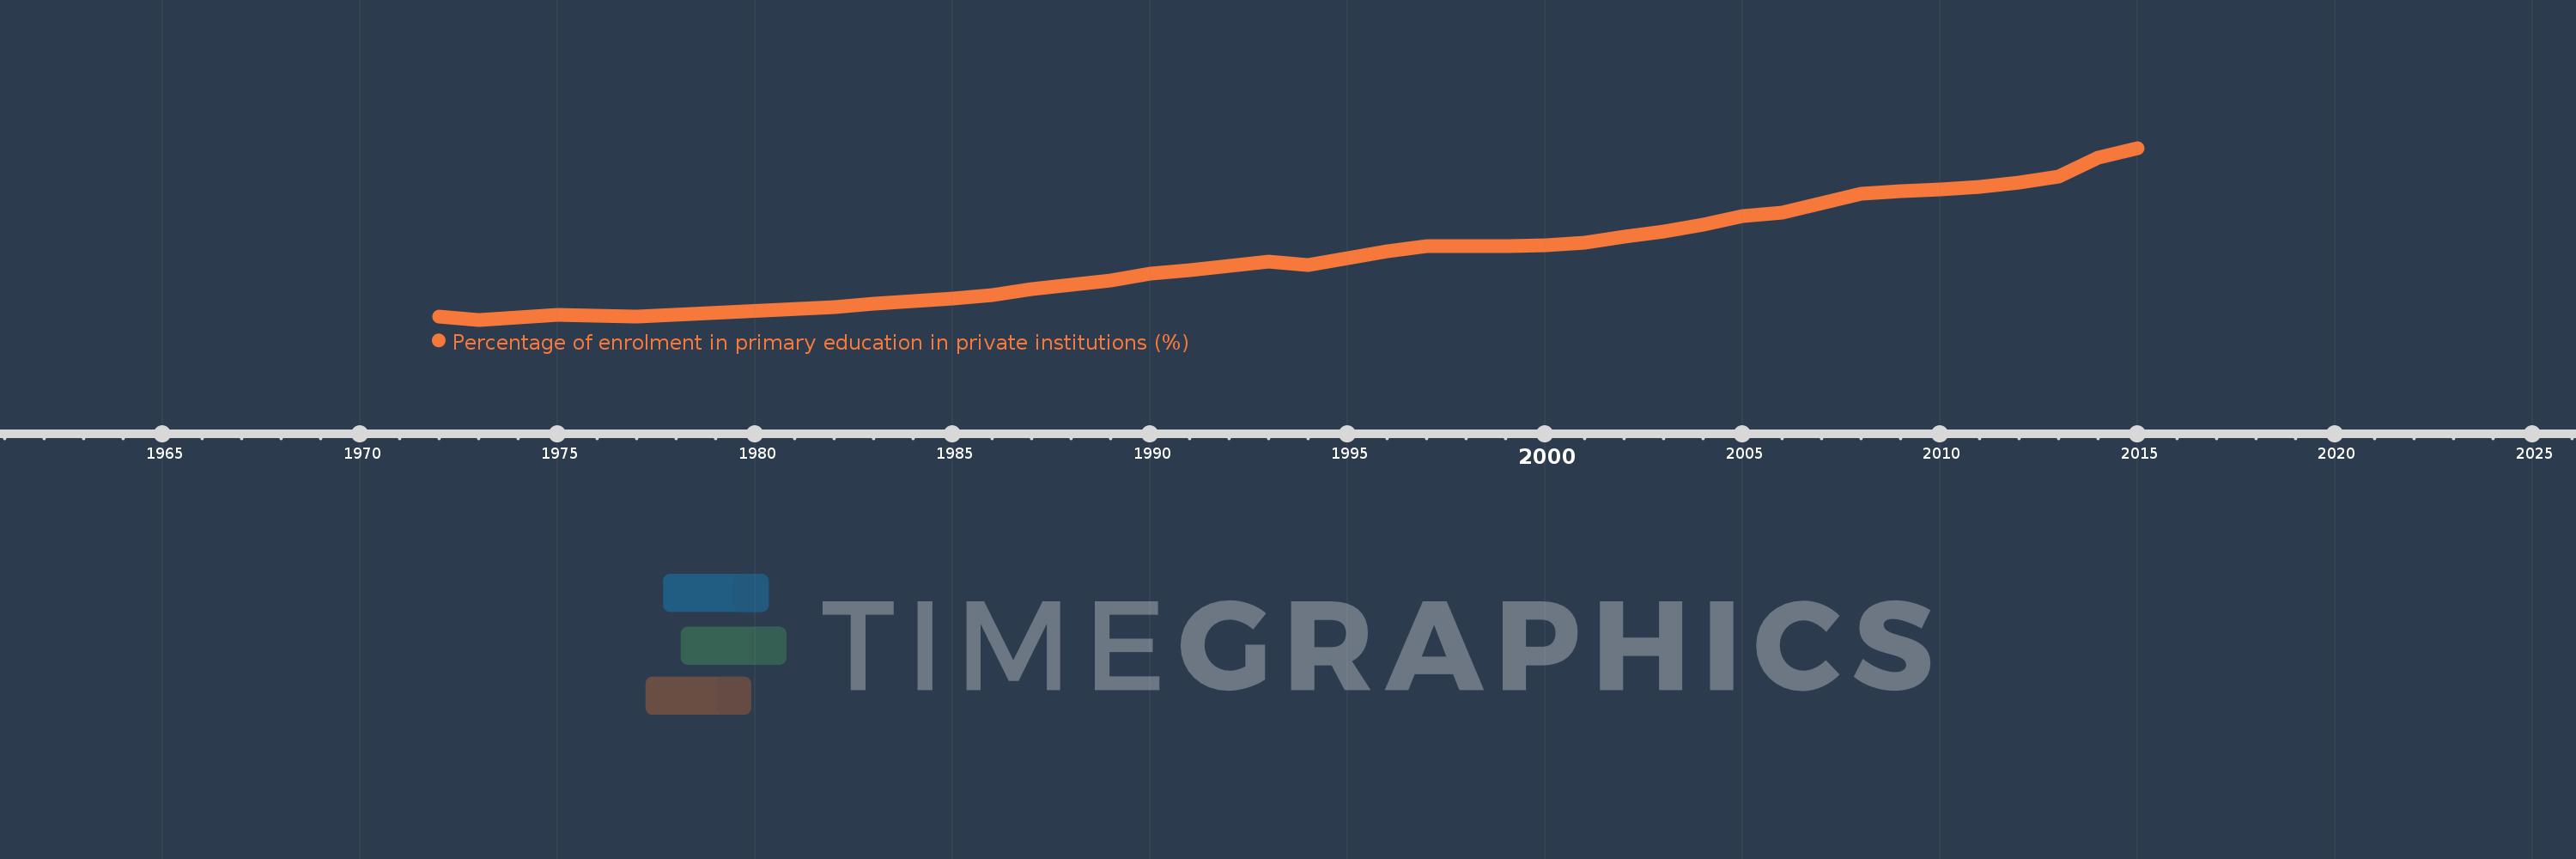
Percentage of enrolment in primary education in private institutions (%)
2015,2014,2013,2012,2011,2010,2009,2008,2006,2005,2004,2003,2002,2001,2000,1999,1997,1996,1995,1994,1993,1992,1991,1990,1989,1988,1987,1986,1985,1983,1982,1977,1976,1975,1974,1973,1972
This statistics in other country:
AfghanistanAlbaniaAlgeriaAndorraAngolaAntigua and BarbudaArab WorldArgentinaArmeniaArubaAustraliaAustriaAzerbaijanBahamas, TheBahrainBangladeshBarbadosBelarusBelgiumBelizeBeninBermudaBhutanBoliviaBosnia and HerzegovinaBotswanaBrazilBritish Virgin IslandsBrunei DarussalamBulgariaBurkina FasoBurundiCabo VerdeCambodiaCameroonCanadaCaribbean small statesCayman IslandsCentral African RepublicCentral Europe and the BalticsChadChileChinaColombiaComorosCongo, Dem. Rep.Congo, Rep.Costa RicaCote d'IvoireCroatiaCubaCuracaoCyprusCzech RepublicDenmarkDjiboutiDominicaDominican RepublicEarly-demographic dividendEast Asia & PacificEast Asia & Pacific (excluding high income)East Asia & Pacific (IDA & IBRD countries)EcuadorEgypt, Arab Rep.El SalvadorEquatorial GuineaEritreaEstoniaEthiopiaEuro areaEurope & Central AsiaEurope & Central Asia (excluding high income)Europe & Central Asia (IDA & IBRD countries)European UnionFijiFinlandFragile and conflict affected situationsFranceGabonGambia, TheGeorgiaGermanyGhanaGibraltarGreeceGrenadaGuatemalaGuineaGuinea-BissauGuyanaHaitiHeavily indebted poor countries (HIPC)High incomeHondurasHong Kong SAR, ChinaHungaryIBRD onlyIcelandIDA & IBRD totalIDA blendIDA onlyIDA totalIndiaIndonesiaIran, Islamic Rep.IraqIrelandIsraelItalyJamaicaJapanJordanKazakhstanKenyaKiribatiKorea, Rep.KuwaitKyrgyz RepublicLao PDRLate-demographic dividendLatin America & Caribbean Latin America & Caribbean (excluding high income)Latin America & the Caribbean (IDA & IBRD countries)LatviaLeast developed countries: UN classificationLebanonLesothoLiberiaLibyaLiechtensteinLithuaniaLow & middle incomeLow incomeLower middle incomeLuxembourgMacao SAR, ChinaMacedonia, FYRMadagascarMalawiMalaysiaMaldivesMaliMaltaMarshall IslandsMauritaniaMauritiusMexicoMiddle East & North AfricaMiddle East & North Africa (excluding high income)Middle East & North Africa (IDA & IBRD countries)Middle incomeMoldovaMonacoMongoliaMoroccoMozambiqueMyanmarNamibiaNauruNepalNetherlandsNew ZealandNicaraguaNigerNigeriaNorth AmericaNorwayOECD membersOmanOther small statesPacific island small statesPakistanPalauPanamaPapua New GuineaParaguayPeruPhilippinesPolandPortugalPost-demographic dividendPre-demographic dividendPuerto RicoQatarRomaniaRussian FederationRwandaSamoaSan MarinoSao Tome and PrincipeSaudi ArabiaSenegalSerbiaSeychellesSierra LeoneSingaporeSlovak RepublicSloveniaSmall statesSolomon IslandsSomaliaSouth AfricaSouth AsiaSouth Asia (IDA & IBRD)SpainSri LankaSt. Kitts and NevisSt. LuciaSt. Vincent and the GrenadinesSub-Saharan Africa Sub-Saharan Africa (excluding high income)Sub-Saharan Africa (IDA & IBRD countries)SudanSurinameSwazilandSwedenSwitzerlandSyrian Arab RepublicTajikistanTanzaniaThailandTimor-LesteTogoTongaTrinidad and TobagoTunisiaTurkeyTurks and Caicos IslandsTuvaluUgandaUkraineUnited Arab EmiratesUnited KingdomUnited StatesUpper middle incomeUruguayVanuatuVenezuela, RBVietnamWest Bank and GazaWorldYemen, Rep.ZambiaZimbabwe Timeline:
This timeline shows a graph from 1972 to 2015 of Norway. No data until 1971. Number of actual observations by date: 37.
Source name:
World Development Indicators
Source organization:
UNESCO Institute for Statistics
Categories, topics:
Education
Last updated:
apr 23, 2017
Indicators value changes by year
At the date of observation
Value
Absolute change
Change from previous value
jan 1, 1972
0.438
+0.438
0.0%
jan 1, 1973
0.397
-0.041
-9.26%
jan 1, 1974
0.432
+0.035
8.7%
jan 1, 1975
0.469
+0.037
8.53%
jan 1, 1976
0.451
-0.018
-3.77%
jan 1, 1977
0.448
-0.004
-0.8%
jan 1, 1982
0.581
+0.133
29.76%
jan 1, 1983
0.627
+0.047
8.05%
jan 1, 1985
0.704
+0.076
12.13%
jan 1, 1986
0.753
+0.049
6.97%
jan 1, 1987
0.842
+0.09
11.92%
jan 1, 1988
0.895
+0.052
6.22%
jan 1, 1989
0.96
+0.065
7.32%
jan 1, 1990
1.064
+0.104
10.82%
jan 1, 1991
1.107
+0.043
4.05%
jan 1, 1992
1.164
+0.057
5.11%
jan 1, 1993
1.233
+0.07
5.98%
jan 1, 1994
1.185
-0.049
-3.96%
jan 1, 1995
1.281
+0.097
8.18%
jan 1, 1996
1.384
+0.103
8.01%
jan 1, 1997
1.455
+0.071
5.14%
jan 1, 1999
1.448
-0.007
-0.49%
jan 1, 2000
1.462
+0.014
0.94%
jan 1, 2001
1.506
+0.044
3.0%
jan 1, 2002
1.582
+0.076
5.04%
jan 1, 2003
1.662
+0.08
5.07%
jan 1, 2004
1.757
+0.095
5.74%
jan 1, 2005
1.878
+0.121
6.9%
jan 1, 2006
1.936
+0.058
3.07%
jan 1, 2008
2.204
+0.268
13.86%
jan 1, 2009
2.242
+0.038
1.72%
jan 1, 2010
2.262
+0.02
0.89%
jan 1, 2011
2.307
+0.045
1.98%
jan 1, 2012
2.363
+0.057
2.46%
jan 1, 2013
2.45
+0.087
3.67%
jan 1, 2014
2.72
+0.269
10.99%
jan 1, 2015
2.859
+0.14
5.14%
Ranking of countries by current statistics by years


Comments: