29
/
en
AIzaSyAYiBZKx7MnpbEhh9jyipgxe19OcubqV5w
April 1, 2024
89856
Botswana
BWA
true
2
1
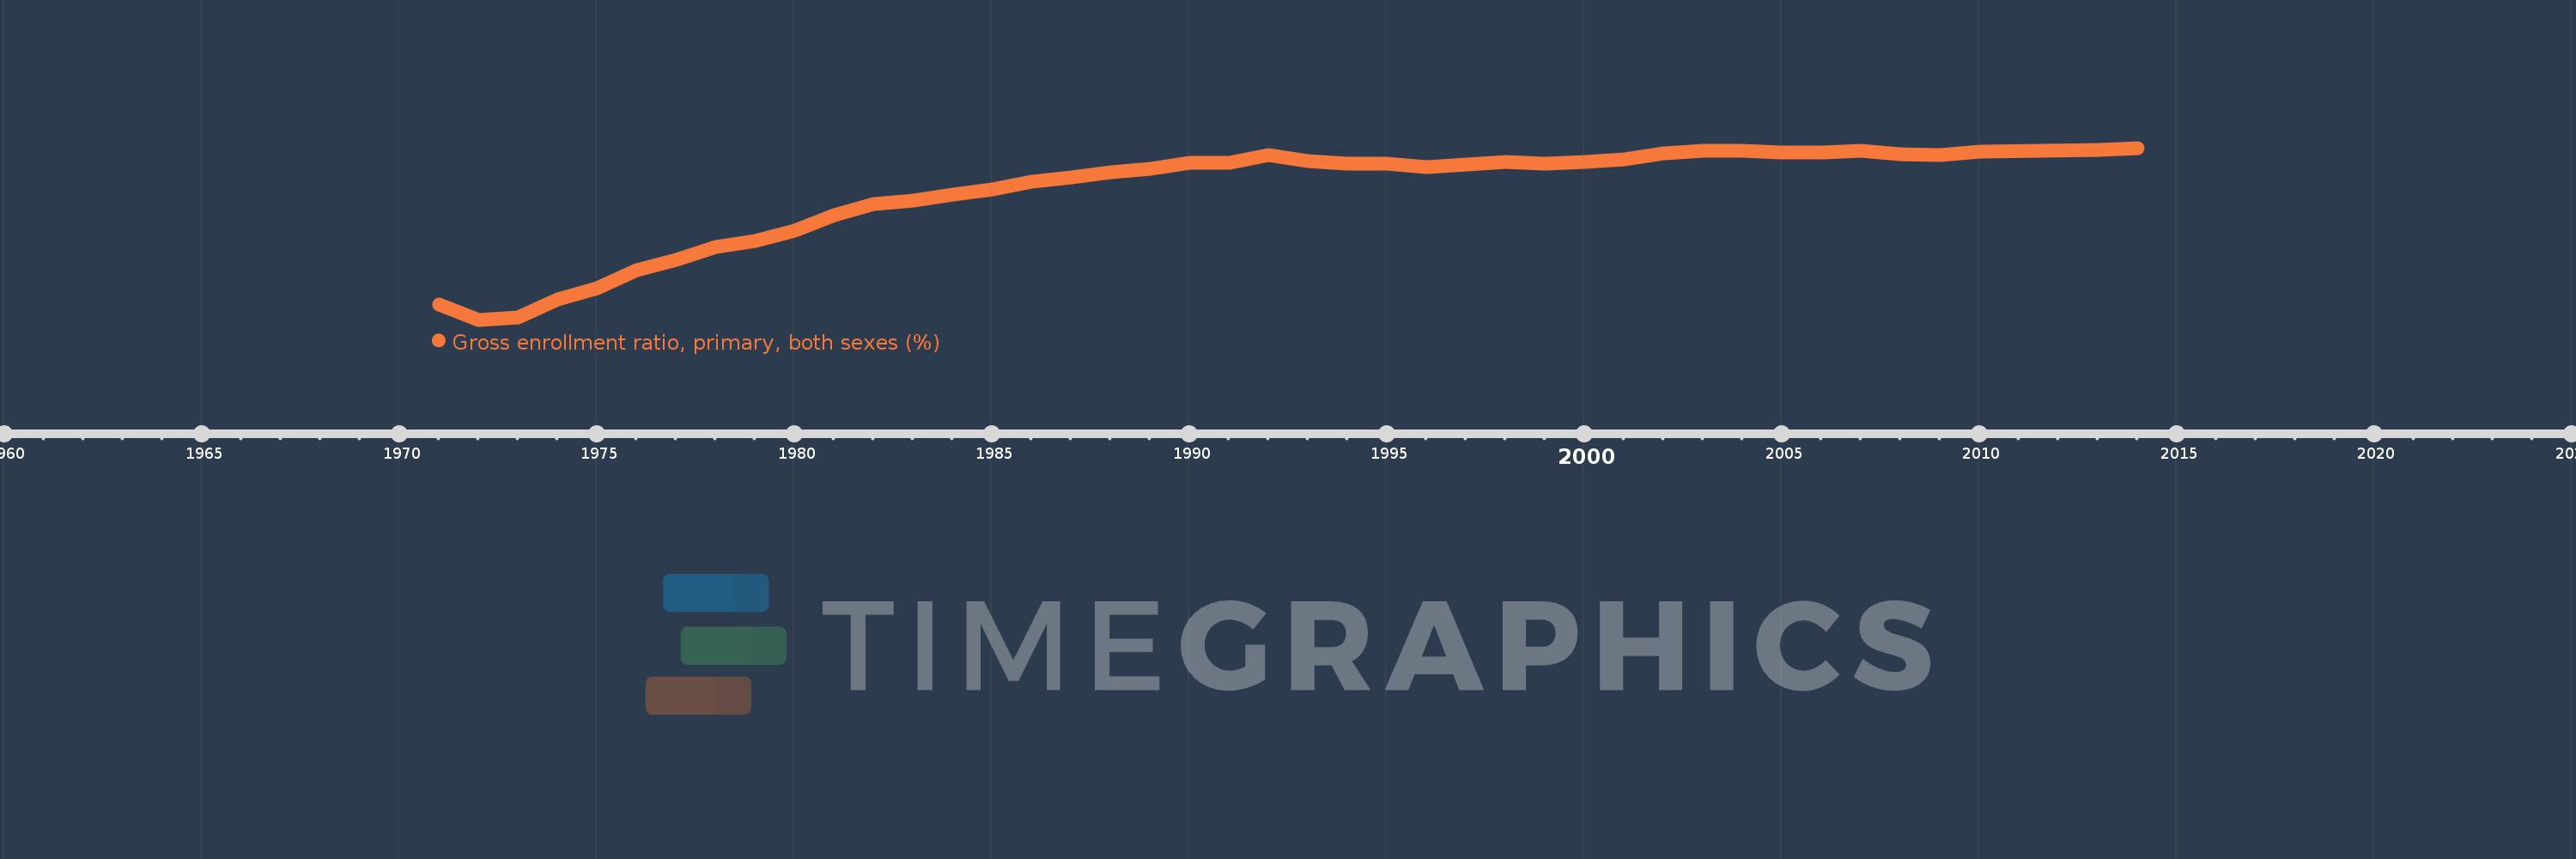
Gross enrollment ratio, primary, both sexes (%)
2014,2013,2010,2009,2008,2007,2006,2005,2004,2003,2002,2001,2000,1999,1998,1997,1996,1995,1994,1993,1992,1991,1990,1989,1988,1987,1986,1985,1984,1983,1982,1981,1980,1979,1978,1977,1976,1975,1974,1973,1972,1971
This statistics in other country:
AfghanistanAlbaniaAlgeriaAndorraAngolaAntigua and BarbudaArab WorldArgentinaArmeniaArubaAustraliaAustriaAzerbaijanBahamas, TheBahrainBangladeshBarbadosBelarusBelgiumBelizeBeninBermudaBhutanBoliviaBosnia and HerzegovinaBotswanaBrazilBritish Virgin IslandsBrunei DarussalamBulgariaBurkina FasoBurundiCabo VerdeCambodiaCameroonCanadaCaribbean small statesCentral African RepublicCentral Europe and the BalticsChadChileChinaColombiaComorosCongo, Dem. Rep.Congo, Rep.Costa RicaCote d'IvoireCroatiaCubaCuracaoCyprusCzech RepublicDenmarkDjiboutiDominicaDominican RepublicEarly-demographic dividendEast Asia & PacificEast Asia & Pacific (excluding high income)East Asia & Pacific (IDA & IBRD countries)EcuadorEgypt, Arab Rep.El SalvadorEquatorial GuineaEritreaEstoniaEthiopiaEuro areaEurope & Central AsiaEurope & Central Asia (excluding high income)Europe & Central Asia (IDA & IBRD countries)European UnionFijiFinlandFragile and conflict affected situationsFranceGabonGambia, TheGeorgiaGermanyGhanaGreeceGrenadaGuatemalaGuineaGuinea-BissauGuyanaHaitiHeavily indebted poor countries (HIPC)High incomeHondurasHong Kong SAR, ChinaHungaryIBRD onlyIcelandIDA & IBRD totalIDA blendIDA onlyIDA totalIndiaIndonesiaIran, Islamic Rep.IraqIrelandIsraelItalyJamaicaJapanJordanKazakhstanKenyaKiribatiKorea, Dem. People’s Rep.Korea, Rep.KuwaitKyrgyz RepublicLao PDRLate-demographic dividendLatin America & Caribbean Latin America & Caribbean (excluding high income)Latin America & the Caribbean (IDA & IBRD countries)LatviaLeast developed countries: UN classificationLebanonLesothoLiberiaLibyaLiechtensteinLithuaniaLow & middle incomeLow incomeLower middle incomeLuxembourgMacao SAR, ChinaMacedonia, FYRMadagascarMalawiMalaysiaMaldivesMaliMaltaMarshall IslandsMauritaniaMauritiusMexicoMicronesia, Fed. Sts.Middle East & North AfricaMiddle East & North Africa (excluding high income)Middle East & North Africa (IDA & IBRD countries)Middle incomeMoldovaMongoliaMontenegroMoroccoMozambiqueMyanmarNamibiaNauruNepalNetherlandsNew ZealandNicaraguaNigerNigeriaNorth AmericaNorwayOECD membersOmanOther small statesPacific island small statesPakistanPalauPanamaPapua New GuineaParaguayPeruPhilippinesPolandPortugalPost-demographic dividendPre-demographic dividendPuerto RicoQatarRomaniaRussian FederationRwandaSamoaSan MarinoSao Tome and PrincipeSaudi ArabiaSenegalSerbiaSeychellesSierra LeoneSlovak RepublicSloveniaSmall statesSolomon IslandsSomaliaSouth AfricaSouth AsiaSouth Asia (IDA & IBRD)South SudanSpainSri LankaSt. Kitts and NevisSt. LuciaSt. Vincent and the GrenadinesSub-Saharan Africa Sub-Saharan Africa (excluding high income)Sub-Saharan Africa (IDA & IBRD countries)SudanSurinameSwazilandSwedenSwitzerlandSyrian Arab RepublicTajikistanTanzaniaThailandTimor-LesteTogoTongaTrinidad and TobagoTunisiaTurkeyTurkmenistanTuvaluUgandaUkraineUnited Arab EmiratesUnited KingdomUnited StatesUpper middle incomeUruguayUzbekistanVanuatuVenezuela, RBVietnamWest Bank and GazaWorldYemen, Rep.ZambiaZimbabwe Timeline:
This timeline shows a graph from 1971 to 2014 of Botswana. No data until 1970. Number of actual observations by date: 42.
Source name:
World Development Indicators
Source organization:
UNESCO Institute for Statistics
Categories, topics:
Education
Last updated:
apr 23, 2017
Indicators value changes by year
Minimum:
55.199
jan 1, 1972
Maximum:
108.572
jan 1, 2014
At the date of observation
Value
Absolute change
Change from previous value
jan 1, 1971
59.857
+59.857
0.0%
jan 1, 1972
55.199
-4.658
-7.78%
jan 1, 1973
55.962
+0.762
1.38%
jan 1, 1974
61.644
+5.682
10.15%
jan 1, 1975
64.909
+3.265
5.3%
jan 1, 1976
70.515
+5.606
8.64%
jan 1, 1977
73.702
+3.187
4.52%
jan 1, 1978
77.852
+4.15
5.63%
jan 1, 1979
79.639
+1.787
2.3%
jan 1, 1980
82.811
+3.172
3.98%
jan 1, 1981
87.784
+4.973
6.01%
jan 1, 1982
91.07
+3.286
3.74%
jan 1, 1983
92.162
+1.092
1.2%
jan 1, 1984
94.034
+1.871
2.03%
jan 1, 1985
95.633
+1.6
1.7%
jan 1, 1986
97.991
+2.358
2.47%
jan 1, 1987
99.451
+1.46
1.49%
jan 1, 1988
100.916
+1.465
1.47%
jan 1, 1989
102.16
+1.244
1.23%
jan 1, 1990
104.05
+1.89
1.85%
jan 1, 1991
103.838
-0.212
-0.2%
jan 1, 1992
106.25
+2.412
2.32%
jan 1, 1993
104.497
-1.753
-1.65%
jan 1, 1994
103.696
-0.801
-0.77%
jan 1, 1995
103.626
-0.07
-0.07%
jan 1, 1996
102.74
-0.886
-0.86%
jan 1, 1997
103.483
+0.743
0.72%
jan 1, 1998
104.162
+0.679
0.66%
jan 1, 1999
103.646
-0.516
-0.5%
jan 1, 2000
104.133
+0.488
0.47%
jan 1, 2001
105.082
+0.948
0.91%
jan 1, 2002
106.918
+1.836
1.75%
jan 1, 2003
107.59
+0.672
0.63%
jan 1, 2004
107.624
+0.034
0.03%
jan 1, 2005
107.138
-0.485
-0.45%
jan 1, 2006
107.195
+0.057
0.05%
jan 1, 2007
107.645
+0.45
0.42%
jan 1, 2008
106.69
-0.955
-0.89%
jan 1, 2009
106.479
-0.211
-0.2%
jan 1, 2010
107.51
+1.03
0.97%
jan 1, 2013
108.066
+0.556
0.52%
jan 1, 2014
108.572
+0.507
0.47%
Ranking of countries by current statistics by years


Comments: