29
/
en
AIzaSyAYiBZKx7MnpbEhh9jyipgxe19OcubqV5w
April 1, 2024
222237
Peru
PER
true
2
1
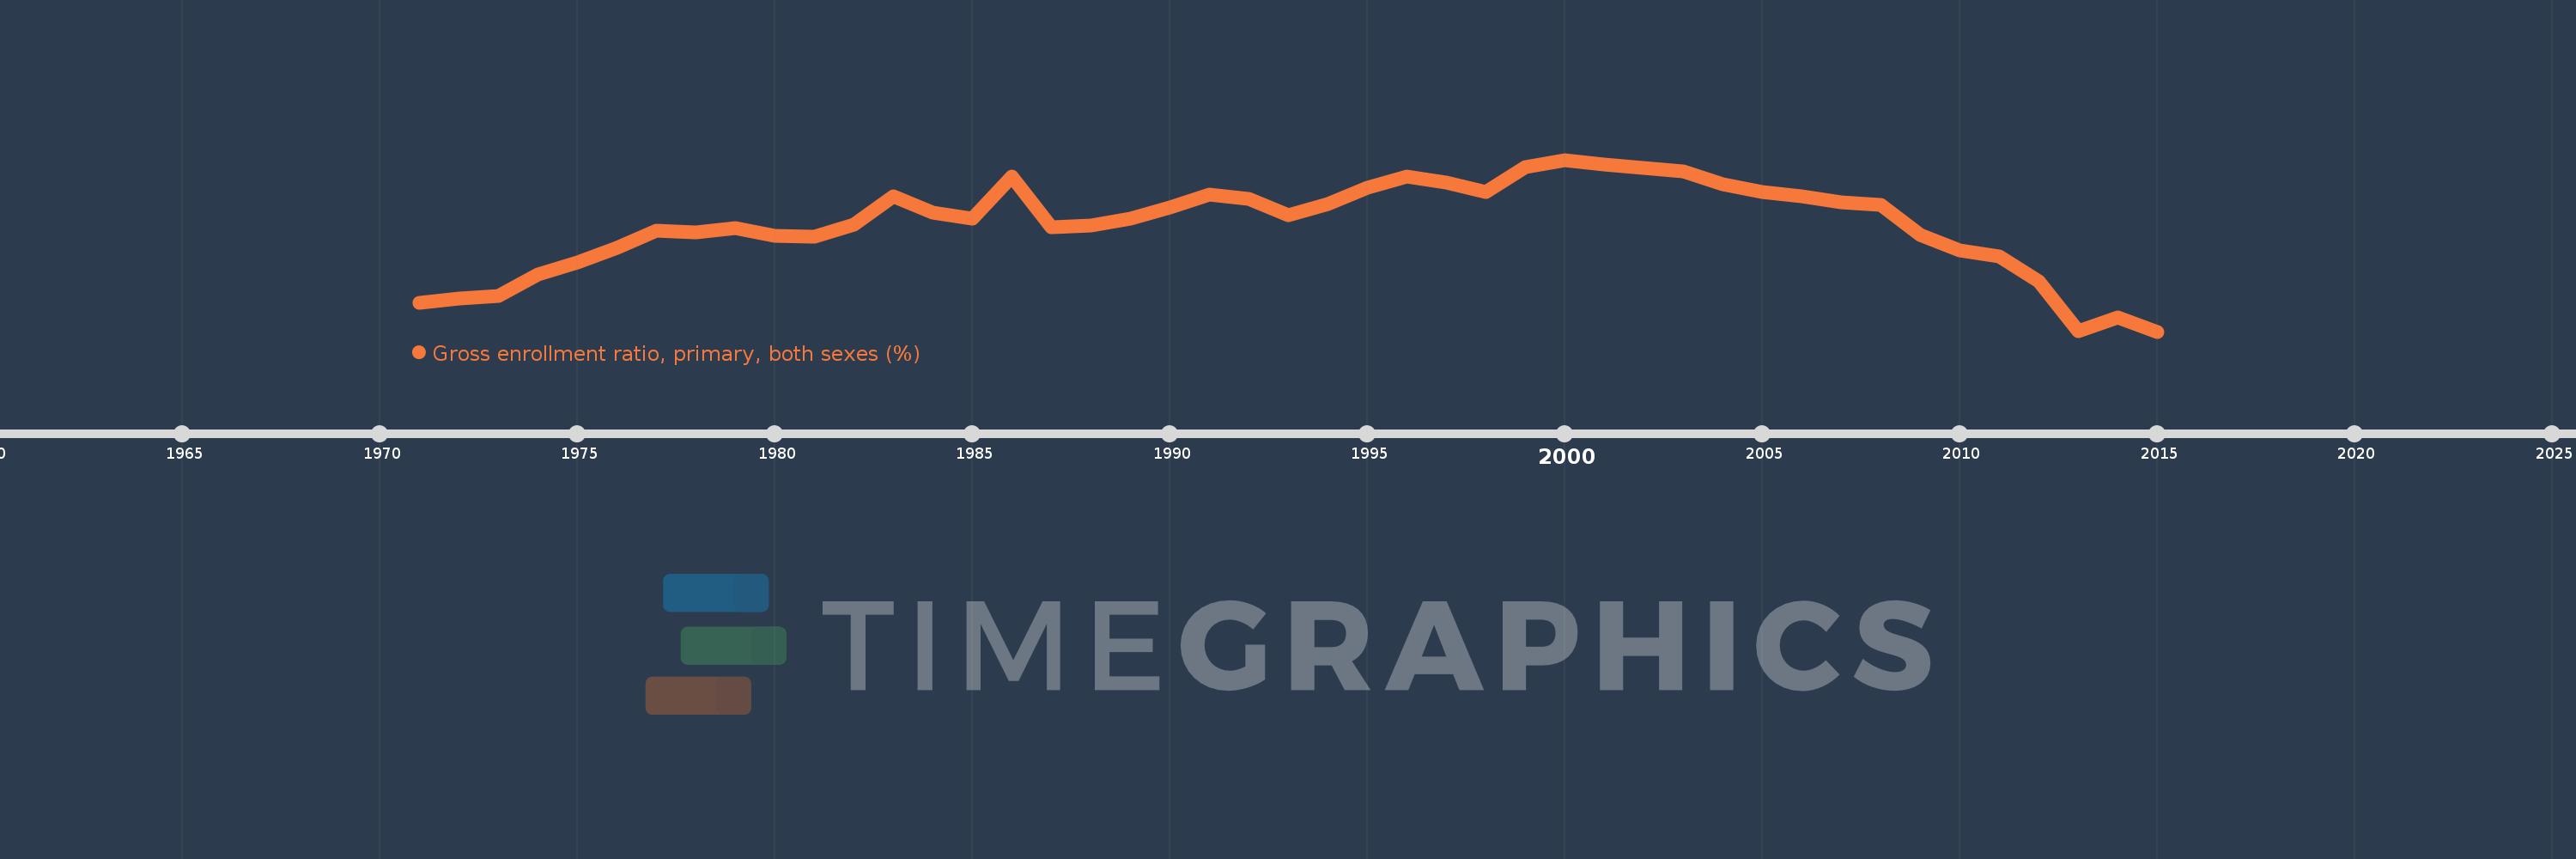
Gross enrollment ratio, primary, both sexes (%)
2015,2014,2013,2012,2011,2010,2009,2008,2007,2006,2005,2004,2003,2002,2001,2000,1999,1998,1997,1996,1995,1994,1993,1992,1991,1990,1989,1988,1987,1986,1985,1984,1983,1982,1981,1980,1979,1978,1977,1976,1975,1974,1973,1972,1971
This statistics in other country:
AfghanistanAlbaniaAlgeriaAndorraAngolaAntigua and BarbudaArab WorldArgentinaArmeniaArubaAustraliaAustriaAzerbaijanBahamas, TheBahrainBangladeshBarbadosBelarusBelgiumBelizeBeninBermudaBhutanBoliviaBosnia and HerzegovinaBotswanaBrazilBritish Virgin IslandsBrunei DarussalamBulgariaBurkina FasoBurundiCabo VerdeCambodiaCameroonCanadaCaribbean small statesCentral African RepublicCentral Europe and the BalticsChadChileChinaColombiaComorosCongo, Dem. Rep.Congo, Rep.Costa RicaCote d'IvoireCroatiaCubaCuracaoCyprusCzech RepublicDenmarkDjiboutiDominicaDominican RepublicEarly-demographic dividendEast Asia & PacificEast Asia & Pacific (excluding high income)East Asia & Pacific (IDA & IBRD countries)EcuadorEgypt, Arab Rep.El SalvadorEquatorial GuineaEritreaEstoniaEthiopiaEuro areaEurope & Central AsiaEurope & Central Asia (excluding high income)Europe & Central Asia (IDA & IBRD countries)European UnionFijiFinlandFragile and conflict affected situationsFranceGabonGambia, TheGeorgiaGermanyGhanaGreeceGrenadaGuatemalaGuineaGuinea-BissauGuyanaHaitiHeavily indebted poor countries (HIPC)High incomeHondurasHong Kong SAR, ChinaHungaryIBRD onlyIcelandIDA & IBRD totalIDA blendIDA onlyIDA totalIndiaIndonesiaIran, Islamic Rep.IraqIrelandIsraelItalyJamaicaJapanJordanKazakhstanKenyaKiribatiKorea, Dem. People’s Rep.Korea, Rep.KuwaitKyrgyz RepublicLao PDRLate-demographic dividendLatin America & Caribbean Latin America & Caribbean (excluding high income)Latin America & the Caribbean (IDA & IBRD countries)LatviaLeast developed countries: UN classificationLebanonLesothoLiberiaLibyaLiechtensteinLithuaniaLow & middle incomeLow incomeLower middle incomeLuxembourgMacao SAR, ChinaMacedonia, FYRMadagascarMalawiMalaysiaMaldivesMaliMaltaMarshall IslandsMauritaniaMauritiusMexicoMicronesia, Fed. Sts.Middle East & North AfricaMiddle East & North Africa (excluding high income)Middle East & North Africa (IDA & IBRD countries)Middle incomeMoldovaMongoliaMontenegroMoroccoMozambiqueMyanmarNamibiaNauruNepalNetherlandsNew ZealandNicaraguaNigerNigeriaNorth AmericaNorwayOECD membersOmanOther small statesPacific island small statesPakistanPalauPanamaPapua New GuineaParaguayPeruPhilippinesPolandPortugalPost-demographic dividendPre-demographic dividendPuerto RicoQatarRomaniaRussian FederationRwandaSamoaSan MarinoSao Tome and PrincipeSaudi ArabiaSenegalSerbiaSeychellesSierra LeoneSlovak RepublicSloveniaSmall statesSolomon IslandsSomaliaSouth AfricaSouth AsiaSouth Asia (IDA & IBRD)South SudanSpainSri LankaSt. Kitts and NevisSt. LuciaSt. Vincent and the GrenadinesSub-Saharan Africa Sub-Saharan Africa (excluding high income)Sub-Saharan Africa (IDA & IBRD countries)SudanSurinameSwazilandSwedenSwitzerlandSyrian Arab RepublicTajikistanTanzaniaThailandTimor-LesteTogoTongaTrinidad and TobagoTunisiaTurkeyTurkmenistanTuvaluUgandaUkraineUnited Arab EmiratesUnited KingdomUnited StatesUpper middle incomeUruguayUzbekistanVanuatuVenezuela, RBVietnamWest Bank and GazaWorldYemen, Rep.ZambiaZimbabwe Timeline:
This timeline shows a graph from 1971 to 2015 of Peru. No data until 1970. Number of actual observations by date: 45.
Source name:
World Development Indicators
Source organization:
UNESCO Institute for Statistics
Categories, topics:
Education
Last updated:
apr 23, 2017
Indicators value changes by year
Minimum:
101.422
jan 1, 2015
Maximum:
121.861
jan 1, 2000
At the date of observation
Value
Absolute change
Change from previous value
jan 1, 1971
104.864
+104.864
0.0%
jan 1, 1972
105.345
+0.481
0.46%
jan 1, 1973
105.677
+0.332
0.31%
jan 1, 1974
108.233
+2.556
2.42%
jan 1, 1975
109.673
+1.44
1.33%
jan 1, 1976
111.411
+1.739
1.59%
jan 1, 1977
113.46
+2.049
1.84%
jan 1, 1978
113.232
-0.228
-0.2%
jan 1, 1979
113.784
+0.552
0.49%
jan 1, 1980
112.781
-1.003
-0.88%
jan 1, 1981
112.748
-0.033
-0.03%
jan 1, 1982
114.172
+1.424
1.26%
jan 1, 1983
117.56
+3.388
2.97%
jan 1, 1984
115.57
-1.989
-1.69%
jan 1, 1985
114.901
-0.669
-0.58%
jan 1, 1986
119.841
+4.94
4.3%
jan 1, 1987
113.883
-5.958
-4.97%
jan 1, 1988
114.089
+0.206
0.18%
jan 1, 1989
114.887
+0.798
0.7%
jan 1, 1990
116.232
+1.345
1.17%
jan 1, 1991
117.771
+1.538
1.32%
jan 1, 1992
117.225
-0.546
-0.46%
jan 1, 1993
115.238
-1.987
-1.7%
jan 1, 1994
116.591
+1.353
1.17%
jan 1, 1995
118.53
+1.939
1.66%
jan 1, 1996
119.873
+1.343
1.13%
jan 1, 1997
119.184
-0.689
-0.57%
jan 1, 1998
118.065
-1.119
-0.94%
jan 1, 1999
121.016
+2.951
2.5%
jan 1, 2000
121.861
+0.845
0.7%
jan 1, 2001
121.3
-0.561
-0.46%
jan 1, 2002
120.893
-0.406
-0.34%
jan 1, 2003
120.458
-0.435
-0.36%
jan 1, 2004
118.941
-1.517
-1.26%
jan 1, 2005
118.03
-0.911
-0.77%
jan 1, 2006
117.475
-0.555
-0.47%
jan 1, 2007
116.8
-0.675
-0.57%
jan 1, 2008
116.517
-0.283
-0.24%
jan 1, 2009
112.891
-3.625
-3.11%
jan 1, 2010
111.105
-1.787
-1.58%
jan 1, 2011
110.365
-0.74
-0.67%
jan 1, 2012
107.357
-3.008
-2.73%
jan 1, 2013
101.441
-5.915
-5.51%
jan 1, 2014
103.109
+1.667
1.64%
jan 1, 2015
101.422
-1.687
-1.64%
Ranking of countries by current statistics by years


Comments: