29
/
en
AIzaSyAYiBZKx7MnpbEhh9jyipgxe19OcubqV5w
April 1, 2024
260951
Tanzania
TZA
true
2
1
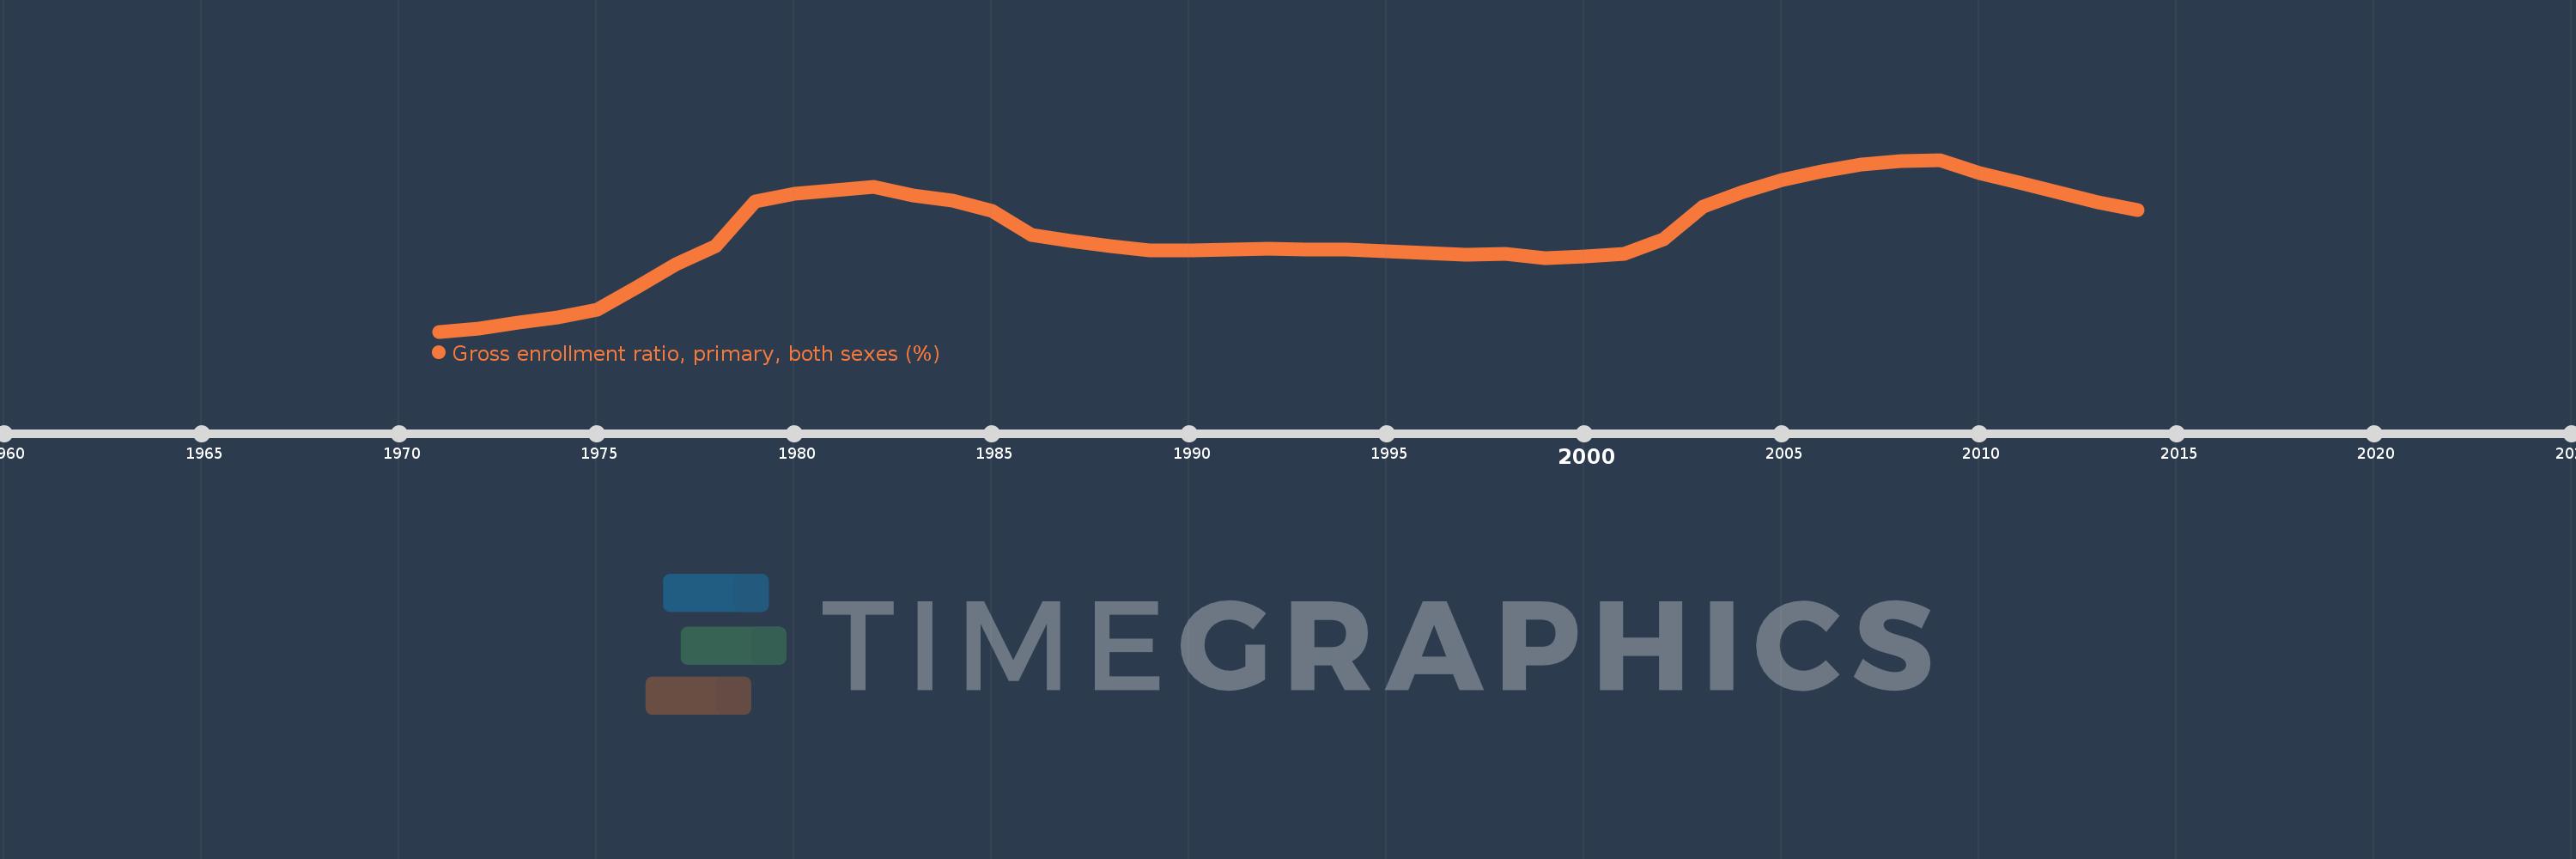
Gross enrollment ratio, primary, both sexes (%)
2014,2013,2011,2010,2009,2008,2007,2006,2005,2004,2003,2002,2001,2000,1999,1998,1997,1996,1995,1994,1993,1992,1991,1990,1989,1988,1987,1986,1985,1984,1983,1982,1981,1980,1979,1978,1977,1976,1975,1974,1973,1972,1971
This statistics in other country:
AfghanistanAlbaniaAlgeriaAndorraAngolaAntigua and BarbudaArab WorldArgentinaArmeniaArubaAustraliaAustriaAzerbaijanBahamas, TheBahrainBangladeshBarbadosBelarusBelgiumBelizeBeninBermudaBhutanBoliviaBosnia and HerzegovinaBotswanaBrazilBritish Virgin IslandsBrunei DarussalamBulgariaBurkina FasoBurundiCabo VerdeCambodiaCameroonCanadaCaribbean small statesCentral African RepublicCentral Europe and the BalticsChadChileChinaColombiaComorosCongo, Dem. Rep.Congo, Rep.Costa RicaCote d'IvoireCroatiaCubaCuracaoCyprusCzech RepublicDenmarkDjiboutiDominicaDominican RepublicEarly-demographic dividendEast Asia & PacificEast Asia & Pacific (excluding high income)East Asia & Pacific (IDA & IBRD countries)EcuadorEgypt, Arab Rep.El SalvadorEquatorial GuineaEritreaEstoniaEthiopiaEuro areaEurope & Central AsiaEurope & Central Asia (excluding high income)Europe & Central Asia (IDA & IBRD countries)European UnionFijiFinlandFragile and conflict affected situationsFranceGabonGambia, TheGeorgiaGermanyGhanaGreeceGrenadaGuatemalaGuineaGuinea-BissauGuyanaHaitiHeavily indebted poor countries (HIPC)High incomeHondurasHong Kong SAR, ChinaHungaryIBRD onlyIcelandIDA & IBRD totalIDA blendIDA onlyIDA totalIndiaIndonesiaIran, Islamic Rep.IraqIrelandIsraelItalyJamaicaJapanJordanKazakhstanKenyaKiribatiKorea, Dem. People’s Rep.Korea, Rep.KuwaitKyrgyz RepublicLao PDRLate-demographic dividendLatin America & Caribbean Latin America & Caribbean (excluding high income)Latin America & the Caribbean (IDA & IBRD countries)LatviaLeast developed countries: UN classificationLebanonLesothoLiberiaLibyaLiechtensteinLithuaniaLow & middle incomeLow incomeLower middle incomeLuxembourgMacao SAR, ChinaMacedonia, FYRMadagascarMalawiMalaysiaMaldivesMaliMaltaMarshall IslandsMauritaniaMauritiusMexicoMicronesia, Fed. Sts.Middle East & North AfricaMiddle East & North Africa (excluding high income)Middle East & North Africa (IDA & IBRD countries)Middle incomeMoldovaMongoliaMontenegroMoroccoMozambiqueMyanmarNamibiaNauruNepalNetherlandsNew ZealandNicaraguaNigerNigeriaNorth AmericaNorwayOECD membersOmanOther small statesPacific island small statesPakistanPalauPanamaPapua New GuineaParaguayPeruPhilippinesPolandPortugalPost-demographic dividendPre-demographic dividendPuerto RicoQatarRomaniaRussian FederationRwandaSamoaSan MarinoSao Tome and PrincipeSaudi ArabiaSenegalSerbiaSeychellesSierra LeoneSlovak RepublicSloveniaSmall statesSolomon IslandsSomaliaSouth AfricaSouth AsiaSouth Asia (IDA & IBRD)South SudanSpainSri LankaSt. Kitts and NevisSt. LuciaSt. Vincent and the GrenadinesSub-Saharan Africa Sub-Saharan Africa (excluding high income)Sub-Saharan Africa (IDA & IBRD countries)SudanSurinameSwazilandSwedenSwitzerlandSyrian Arab RepublicTajikistanTanzaniaThailandTimor-LesteTogoTongaTrinidad and TobagoTunisiaTurkeyTurkmenistanTuvaluUgandaUkraineUnited Arab EmiratesUnited KingdomUnited StatesUpper middle incomeUruguayUzbekistanVanuatuVenezuela, RBVietnamWest Bank and GazaWorldYemen, Rep.ZambiaZimbabwe Timeline:
This timeline shows a graph from 1971 to 2014 of Tanzania. No data until 1970. Number of actual observations by date: 43.
Source name:
World Development Indicators
Source organization:
UNESCO Institute for Statistics
Categories, topics:
Education
Last updated:
apr 23, 2017
Indicators value changes by year
Minimum:
33.823
jan 1, 1971
Maximum:
108.75
jan 1, 2009
At the date of observation
Value
Absolute change
Change from previous value
jan 1, 1971
33.823
+33.823
0.0%
jan 1, 1972
35.228
+1.405
4.15%
jan 1, 1973
37.571
+2.343
6.65%
jan 1, 1974
40.141
+2.569
6.84%
jan 1, 1975
43.411
+3.27
8.15%
jan 1, 1976
53.149
+9.738
22.43%
jan 1, 1977
63.089
+9.94
18.7%
jan 1, 1978
71.035
+7.946
12.6%
jan 1, 1979
90.42
+19.385
27.29%
jan 1, 1980
93.873
+3.453
3.82%
jan 1, 1981
95.398
+1.525
1.62%
jan 1, 1982
96.953
+1.555
1.63%
jan 1, 1983
93.024
-3.929
-4.05%
jan 1, 1984
91.142
-1.882
-2.02%
jan 1, 1985
86.5
-4.642
-5.09%
jan 1, 1986
76.113
-10.387
-12.01%
jan 1, 1987
73.465
-2.649
-3.48%
jan 1, 1988
71.2
-2.265
-3.08%
jan 1, 1989
69.143
-2.057
-2.89%
jan 1, 1990
69.063
-0.08
-0.12%
jan 1, 1991
69.578
+0.515
0.75%
jan 1, 1992
70.022
+0.444
0.64%
jan 1, 1993
69.487
-0.535
-0.76%
jan 1, 1994
69.719
+0.232
0.33%
jan 1, 1995
68.673
-1.046
-1.5%
jan 1, 1996
68.209
-0.465
-0.68%
jan 1, 1997
67.479
-0.73
-1.07%
jan 1, 1998
67.632
+0.154
0.23%
jan 1, 1999
65.675
-1.957
-2.89%
jan 1, 2000
66.425
+0.75
1.14%
jan 1, 2001
67.912
+1.487
2.24%
jan 1, 2002
73.909
+5.997
8.83%
jan 1, 2003
88.45
+14.541
19.67%
jan 1, 2004
94.757
+6.306
7.13%
jan 1, 2005
99.791
+5.034
5.31%
jan 1, 2006
103.596
+3.805
3.81%
jan 1, 2007
106.635
+3.039
2.93%
jan 1, 2008
108.271
+1.636
1.53%
jan 1, 2009
108.75
+0.479
0.44%
jan 1, 2010
102.8
-5.95
-5.47%
jan 1, 2011
98.955
-3.845
-3.74%
jan 1, 2013
90.105
-8.851
-8.94%
jan 1, 2014
86.768
-3.336
-3.7%
Ranking of countries by current statistics by years


Comments: