29
/
en
AIzaSyAYiBZKx7MnpbEhh9jyipgxe19OcubqV5w
April 1, 2024
247598
Spain
ESP
true
2
1
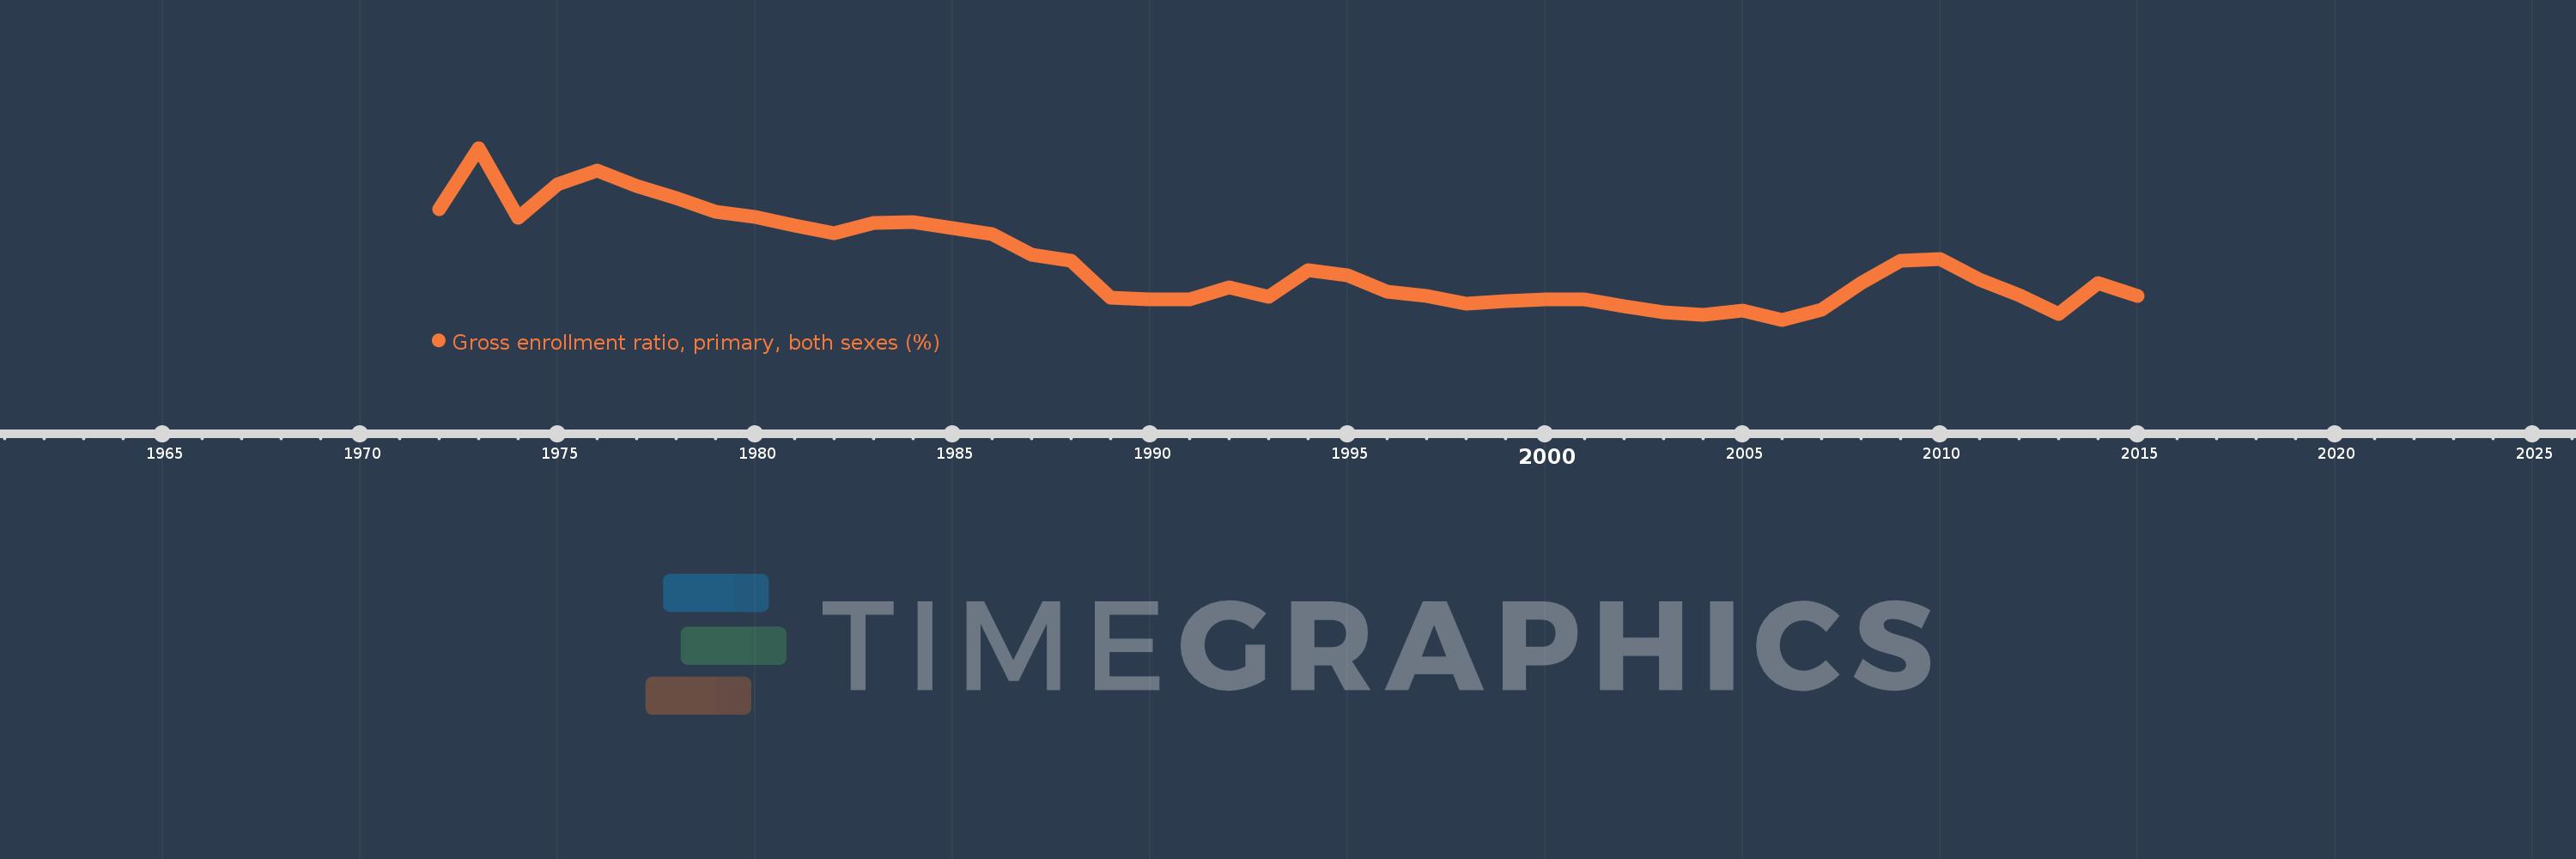
Gross enrollment ratio, primary, both sexes (%)
2015,2014,2013,2012,2011,2010,2009,2008,2007,2006,2005,2004,2003,2002,2001,2000,1999,1998,1997,1996,1995,1994,1993,1992,1991,1990,1989,1988,1987,1986,1985,1984,1983,1982,1981,1980,1979,1978,1977,1976,1975,1974,1973,1972
This statistics in other country:
AfghanistanAlbaniaAlgeriaAndorraAngolaAntigua and BarbudaArab WorldArgentinaArmeniaArubaAustraliaAustriaAzerbaijanBahamas, TheBahrainBangladeshBarbadosBelarusBelgiumBelizeBeninBermudaBhutanBoliviaBosnia and HerzegovinaBotswanaBrazilBritish Virgin IslandsBrunei DarussalamBulgariaBurkina FasoBurundiCabo VerdeCambodiaCameroonCanadaCaribbean small statesCentral African RepublicCentral Europe and the BalticsChadChileChinaColombiaComorosCongo, Dem. Rep.Congo, Rep.Costa RicaCote d'IvoireCroatiaCubaCuracaoCyprusCzech RepublicDenmarkDjiboutiDominicaDominican RepublicEarly-demographic dividendEast Asia & PacificEast Asia & Pacific (excluding high income)East Asia & Pacific (IDA & IBRD countries)EcuadorEgypt, Arab Rep.El SalvadorEquatorial GuineaEritreaEstoniaEthiopiaEuro areaEurope & Central AsiaEurope & Central Asia (excluding high income)Europe & Central Asia (IDA & IBRD countries)European UnionFijiFinlandFragile and conflict affected situationsFranceGabonGambia, TheGeorgiaGermanyGhanaGreeceGrenadaGuatemalaGuineaGuinea-BissauGuyanaHaitiHeavily indebted poor countries (HIPC)High incomeHondurasHong Kong SAR, ChinaHungaryIBRD onlyIcelandIDA & IBRD totalIDA blendIDA onlyIDA totalIndiaIndonesiaIran, Islamic Rep.IraqIrelandIsraelItalyJamaicaJapanJordanKazakhstanKenyaKiribatiKorea, Dem. People’s Rep.Korea, Rep.KuwaitKyrgyz RepublicLao PDRLate-demographic dividendLatin America & Caribbean Latin America & Caribbean (excluding high income)Latin America & the Caribbean (IDA & IBRD countries)LatviaLeast developed countries: UN classificationLebanonLesothoLiberiaLibyaLiechtensteinLithuaniaLow & middle incomeLow incomeLower middle incomeLuxembourgMacao SAR, ChinaMacedonia, FYRMadagascarMalawiMalaysiaMaldivesMaliMaltaMarshall IslandsMauritaniaMauritiusMexicoMicronesia, Fed. Sts.Middle East & North AfricaMiddle East & North Africa (excluding high income)Middle East & North Africa (IDA & IBRD countries)Middle incomeMoldovaMongoliaMontenegroMoroccoMozambiqueMyanmarNamibiaNauruNepalNetherlandsNew ZealandNicaraguaNigerNigeriaNorth AmericaNorwayOECD membersOmanOther small statesPacific island small statesPakistanPalauPanamaPapua New GuineaParaguayPeruPhilippinesPolandPortugalPost-demographic dividendPre-demographic dividendPuerto RicoQatarRomaniaRussian FederationRwandaSamoaSan MarinoSao Tome and PrincipeSaudi ArabiaSenegalSerbiaSeychellesSierra LeoneSlovak RepublicSloveniaSmall statesSolomon IslandsSomaliaSouth AfricaSouth AsiaSouth Asia (IDA & IBRD)South SudanSpainSri LankaSt. Kitts and NevisSt. LuciaSt. Vincent and the GrenadinesSub-Saharan Africa Sub-Saharan Africa (excluding high income)Sub-Saharan Africa (IDA & IBRD countries)SudanSurinameSwazilandSwedenSwitzerlandSyrian Arab RepublicTajikistanTanzaniaThailandTimor-LesteTogoTongaTrinidad and TobagoTunisiaTurkeyTurkmenistanTuvaluUgandaUkraineUnited Arab EmiratesUnited KingdomUnited StatesUpper middle incomeUruguayUzbekistanVanuatuVenezuela, RBVietnamWest Bank and GazaWorldYemen, Rep.ZambiaZimbabwe Timeline:
This timeline shows a graph from 1972 to 2015 of Spain. No data until 1971. Number of actual observations by date: 44.
Source name:
World Development Indicators
Source organization:
UNESCO Institute for Statistics
Categories, topics:
Education
Last updated:
apr 23, 2017
Indicators value changes by year
Minimum:
103.157
jan 1, 2006
Maximum:
114.422
jan 1, 1973
At the date of observation
Value
Absolute change
Change from previous value
jan 1, 1972
110.391
+110.391
0.0%
jan 1, 1973
114.422
+4.032
3.65%
jan 1, 1974
109.855
-4.567
-3.99%
jan 1, 1975
112.05
+2.195
2.0%
jan 1, 1976
112.918
+0.868
0.77%
jan 1, 1977
111.93
-0.988
-0.87%
jan 1, 1978
111.113
-0.817
-0.73%
jan 1, 1979
110.264
-0.849
-0.76%
jan 1, 1980
109.907
-0.357
-0.32%
jan 1, 1981
109.36
-0.547
-0.5%
jan 1, 1982
108.856
-0.504
-0.46%
jan 1, 1983
109.48
+0.624
0.57%
jan 1, 1984
109.576
+0.095
0.09%
jan 1, 1985
109.145
-0.431
-0.39%
jan 1, 1986
108.758
-0.387
-0.35%
jan 1, 1987
107.446
-1.312
-1.21%
jan 1, 1988
107.012
-0.434
-0.4%
jan 1, 1989
104.616
-2.396
-2.24%
jan 1, 1990
104.492
-0.124
-0.12%
jan 1, 1991
104.477
-0.015
-0.01%
jan 1, 1992
105.28
+0.803
0.77%
jan 1, 1993
104.641
-0.639
-0.61%
jan 1, 1994
106.409
+1.767
1.69%
jan 1, 1995
106.068
-0.341
-0.32%
jan 1, 1996
104.991
-1.076
-1.01%
jan 1, 1997
104.699
-0.293
-0.28%
jan 1, 1998
104.205
-0.494
-0.47%
jan 1, 1999
104.354
+0.149
0.14%
jan 1, 2000
104.5
+0.146
0.14%
jan 1, 2001
104.481
-0.019
-0.02%
jan 1, 2002
104.026
-0.455
-0.44%
jan 1, 2003
103.62
-0.406
-0.39%
jan 1, 2004
103.477
-0.143
-0.14%
jan 1, 2005
103.732
+0.255
0.25%
jan 1, 2006
103.157
-0.575
-0.55%
jan 1, 2007
103.819
+0.662
0.64%
jan 1, 2008
105.586
+1.767
1.7%
jan 1, 2009
107.034
+1.448
1.37%
jan 1, 2010
107.167
+0.134
0.12%
jan 1, 2011
105.784
-1.383
-1.29%
jan 1, 2012
104.76
-1.025
-0.97%
jan 1, 2013
103.547
-1.213
-1.16%
jan 1, 2014
105.563
+2.016
1.95%
jan 1, 2015
104.69
-0.872
-0.83%
Ranking of countries by current statistics by years


Comments: