29
/
en
AIzaSyAYiBZKx7MnpbEhh9jyipgxe19OcubqV5w
April 1, 2024
30718
Europe & Central Asia
ECS
false
2
1
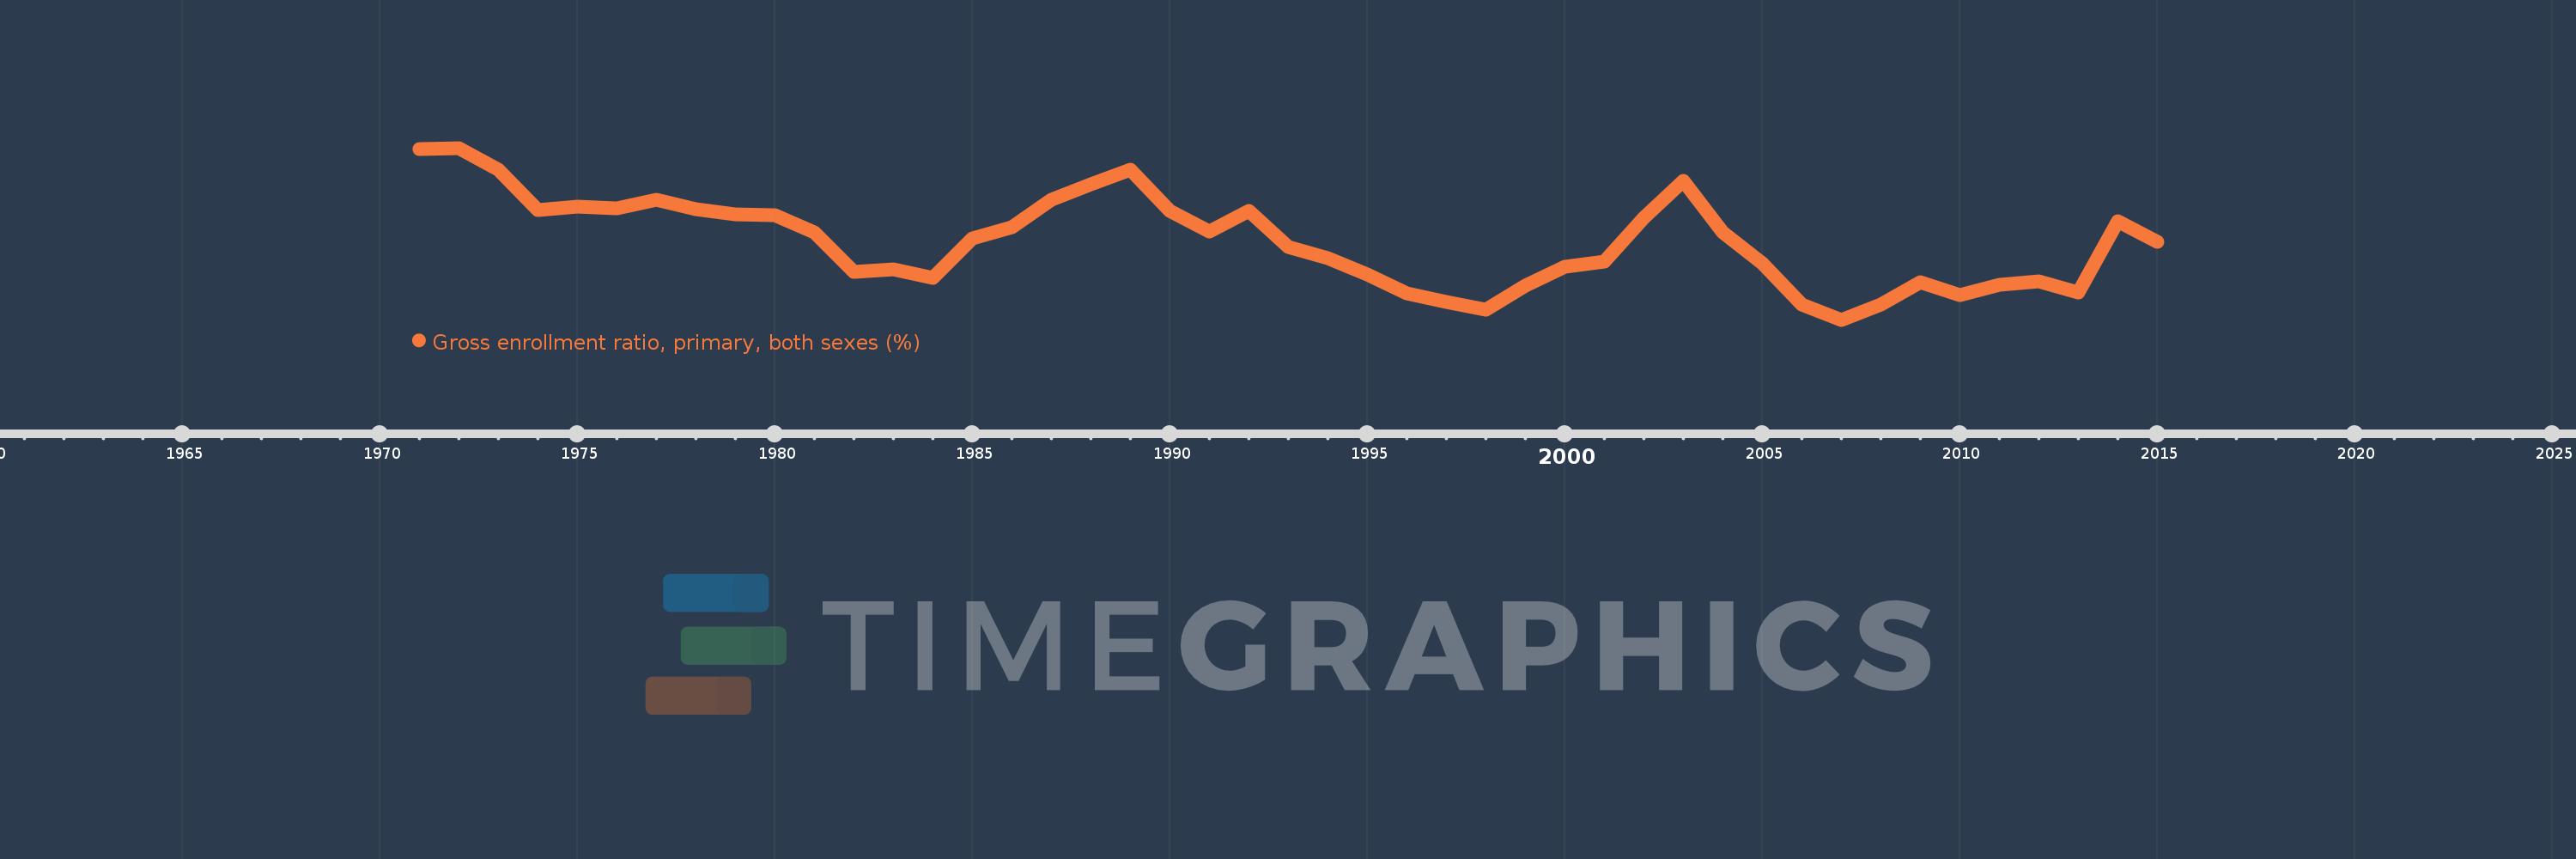
Gross enrollment ratio, primary, both sexes (%)
2015,2014,2013,2012,2011,2010,2009,2008,2007,2006,2005,2004,2003,2002,2001,2000,1999,1998,1997,1996,1995,1994,1993,1992,1991,1990,1989,1988,1987,1986,1985,1984,1983,1982,1981,1980,1979,1978,1977,1976,1975,1974,1973,1972,1971
This statistics in other country:
AfghanistanAlbaniaAlgeriaAndorraAngolaAntigua and BarbudaArab WorldArgentinaArmeniaArubaAustraliaAustriaAzerbaijanBahamas, TheBahrainBangladeshBarbadosBelarusBelgiumBelizeBeninBermudaBhutanBoliviaBosnia and HerzegovinaBotswanaBrazilBritish Virgin IslandsBrunei DarussalamBulgariaBurkina FasoBurundiCabo VerdeCambodiaCameroonCanadaCaribbean small statesCentral African RepublicCentral Europe and the BalticsChadChileChinaColombiaComorosCongo, Dem. Rep.Congo, Rep.Costa RicaCote d'IvoireCroatiaCubaCuracaoCyprusCzech RepublicDenmarkDjiboutiDominicaDominican RepublicEarly-demographic dividendEast Asia & PacificEast Asia & Pacific (excluding high income)East Asia & Pacific (IDA & IBRD countries)EcuadorEgypt, Arab Rep.El SalvadorEquatorial GuineaEritreaEstoniaEthiopiaEuro areaEurope & Central AsiaEurope & Central Asia (excluding high income)Europe & Central Asia (IDA & IBRD countries)European UnionFijiFinlandFragile and conflict affected situationsFranceGabonGambia, TheGeorgiaGermanyGhanaGreeceGrenadaGuatemalaGuineaGuinea-BissauGuyanaHaitiHeavily indebted poor countries (HIPC)High incomeHondurasHong Kong SAR, ChinaHungaryIBRD onlyIcelandIDA & IBRD totalIDA blendIDA onlyIDA totalIndiaIndonesiaIran, Islamic Rep.IraqIrelandIsraelItalyJamaicaJapanJordanKazakhstanKenyaKiribatiKorea, Dem. People’s Rep.Korea, Rep.KuwaitKyrgyz RepublicLao PDRLate-demographic dividendLatin America & Caribbean Latin America & Caribbean (excluding high income)Latin America & the Caribbean (IDA & IBRD countries)LatviaLeast developed countries: UN classificationLebanonLesothoLiberiaLibyaLiechtensteinLithuaniaLow & middle incomeLow incomeLower middle incomeLuxembourgMacao SAR, ChinaMacedonia, FYRMadagascarMalawiMalaysiaMaldivesMaliMaltaMarshall IslandsMauritaniaMauritiusMexicoMicronesia, Fed. Sts.Middle East & North AfricaMiddle East & North Africa (excluding high income)Middle East & North Africa (IDA & IBRD countries)Middle incomeMoldovaMongoliaMontenegroMoroccoMozambiqueMyanmarNamibiaNauruNepalNetherlandsNew ZealandNicaraguaNigerNigeriaNorth AmericaNorwayOECD membersOmanOther small statesPacific island small statesPakistanPalauPanamaPapua New GuineaParaguayPeruPhilippinesPolandPortugalPost-demographic dividendPre-demographic dividendPuerto RicoQatarRomaniaRussian FederationRwandaSamoaSan MarinoSao Tome and PrincipeSaudi ArabiaSenegalSerbiaSeychellesSierra LeoneSlovak RepublicSloveniaSmall statesSolomon IslandsSomaliaSouth AfricaSouth AsiaSouth Asia (IDA & IBRD)South SudanSpainSri LankaSt. Kitts and NevisSt. LuciaSt. Vincent and the GrenadinesSub-Saharan Africa Sub-Saharan Africa (excluding high income)Sub-Saharan Africa (IDA & IBRD countries)SudanSurinameSwazilandSwedenSwitzerlandSyrian Arab RepublicTajikistanTanzaniaThailandTimor-LesteTogoTongaTrinidad and TobagoTunisiaTurkeyTurkmenistanTuvaluUgandaUkraineUnited Arab EmiratesUnited KingdomUnited StatesUpper middle incomeUruguayUzbekistanVanuatuVenezuela, RBVietnamWest Bank and GazaWorldYemen, Rep.ZambiaZimbabwe Timeline:
This timeline shows a graph from 1971 to 2015 of Europe & Central Asia. No data until 1970. Number of actual observations by date: 45.
Source name:
World Development Indicators
Source organization:
UNESCO Institute for Statistics
Categories, topics:
Education
Last updated:
apr 23, 2017
Indicators value changes by year
Minimum:
101.777
jan 1, 2007
Maximum:
105.061
jan 1, 1972
At the date of observation
Value
Absolute change
Change from previous value
jan 1, 1971
105.037
+105.037
0.0%
jan 1, 1972
105.061
+0.024
0.02%
jan 1, 1973
104.643
-0.418
-0.4%
jan 1, 1974
103.869
-0.774
-0.74%
jan 1, 1975
103.937
+0.068
0.07%
jan 1, 1976
103.905
-0.032
-0.03%
jan 1, 1977
104.076
+0.171
0.16%
jan 1, 1978
103.894
-0.182
-0.18%
jan 1, 1979
103.799
-0.096
-0.09%
jan 1, 1980
103.78
-0.019
-0.02%
jan 1, 1981
103.442
-0.338
-0.33%
jan 1, 1982
102.685
-0.757
-0.73%
jan 1, 1983
102.745
+0.06
0.06%
jan 1, 1984
102.569
-0.175
-0.17%
jan 1, 1985
103.333
+0.764
0.74%
jan 1, 1986
103.551
+0.217
0.21%
jan 1, 1987
104.073
+0.522
0.5%
jan 1, 1988
104.371
+0.298
0.29%
jan 1, 1989
104.647
+0.276
0.26%
jan 1, 1990
103.864
-0.784
-0.75%
jan 1, 1991
103.463
-0.401
-0.39%
jan 1, 1992
103.855
+0.392
0.38%
jan 1, 1993
103.17
-0.685
-0.66%
jan 1, 1994
102.96
-0.21
-0.2%
jan 1, 1995
102.645
-0.315
-0.31%
jan 1, 1996
102.289
-0.356
-0.35%
jan 1, 1997
102.122
-0.166
-0.16%
jan 1, 1998
101.964
-0.159
-0.16%
jan 1, 1999
102.429
+0.466
0.46%
jan 1, 2000
102.787
+0.358
0.35%
jan 1, 2001
102.882
+0.095
0.09%
jan 1, 2002
103.728
+0.847
0.82%
jan 1, 2003
104.425
+0.696
0.67%
jan 1, 2004
103.448
-0.976
-0.94%
jan 1, 2005
102.859
-0.589
-0.57%
jan 1, 2006
102.065
-0.794
-0.77%
jan 1, 2007
101.777
-0.288
-0.28%
jan 1, 2008
102.071
+0.294
0.29%
jan 1, 2009
102.494
+0.423
0.41%
jan 1, 2010
102.244
-0.25
-0.24%
jan 1, 2011
102.446
+0.202
0.2%
jan 1, 2012
102.506
+0.06
0.06%
jan 1, 2013
102.303
-0.202
-0.2%
jan 1, 2014
103.654
+1.35
1.32%
jan 1, 2015
103.274
-0.38
-0.37%
Ranking of countries by current statistics by years


Comments: