29
/
en
AIzaSyAYiBZKx7MnpbEhh9jyipgxe19OcubqV5w
April 1, 2024
157337
Iran, Islamic Rep.
IRN
true
2
1
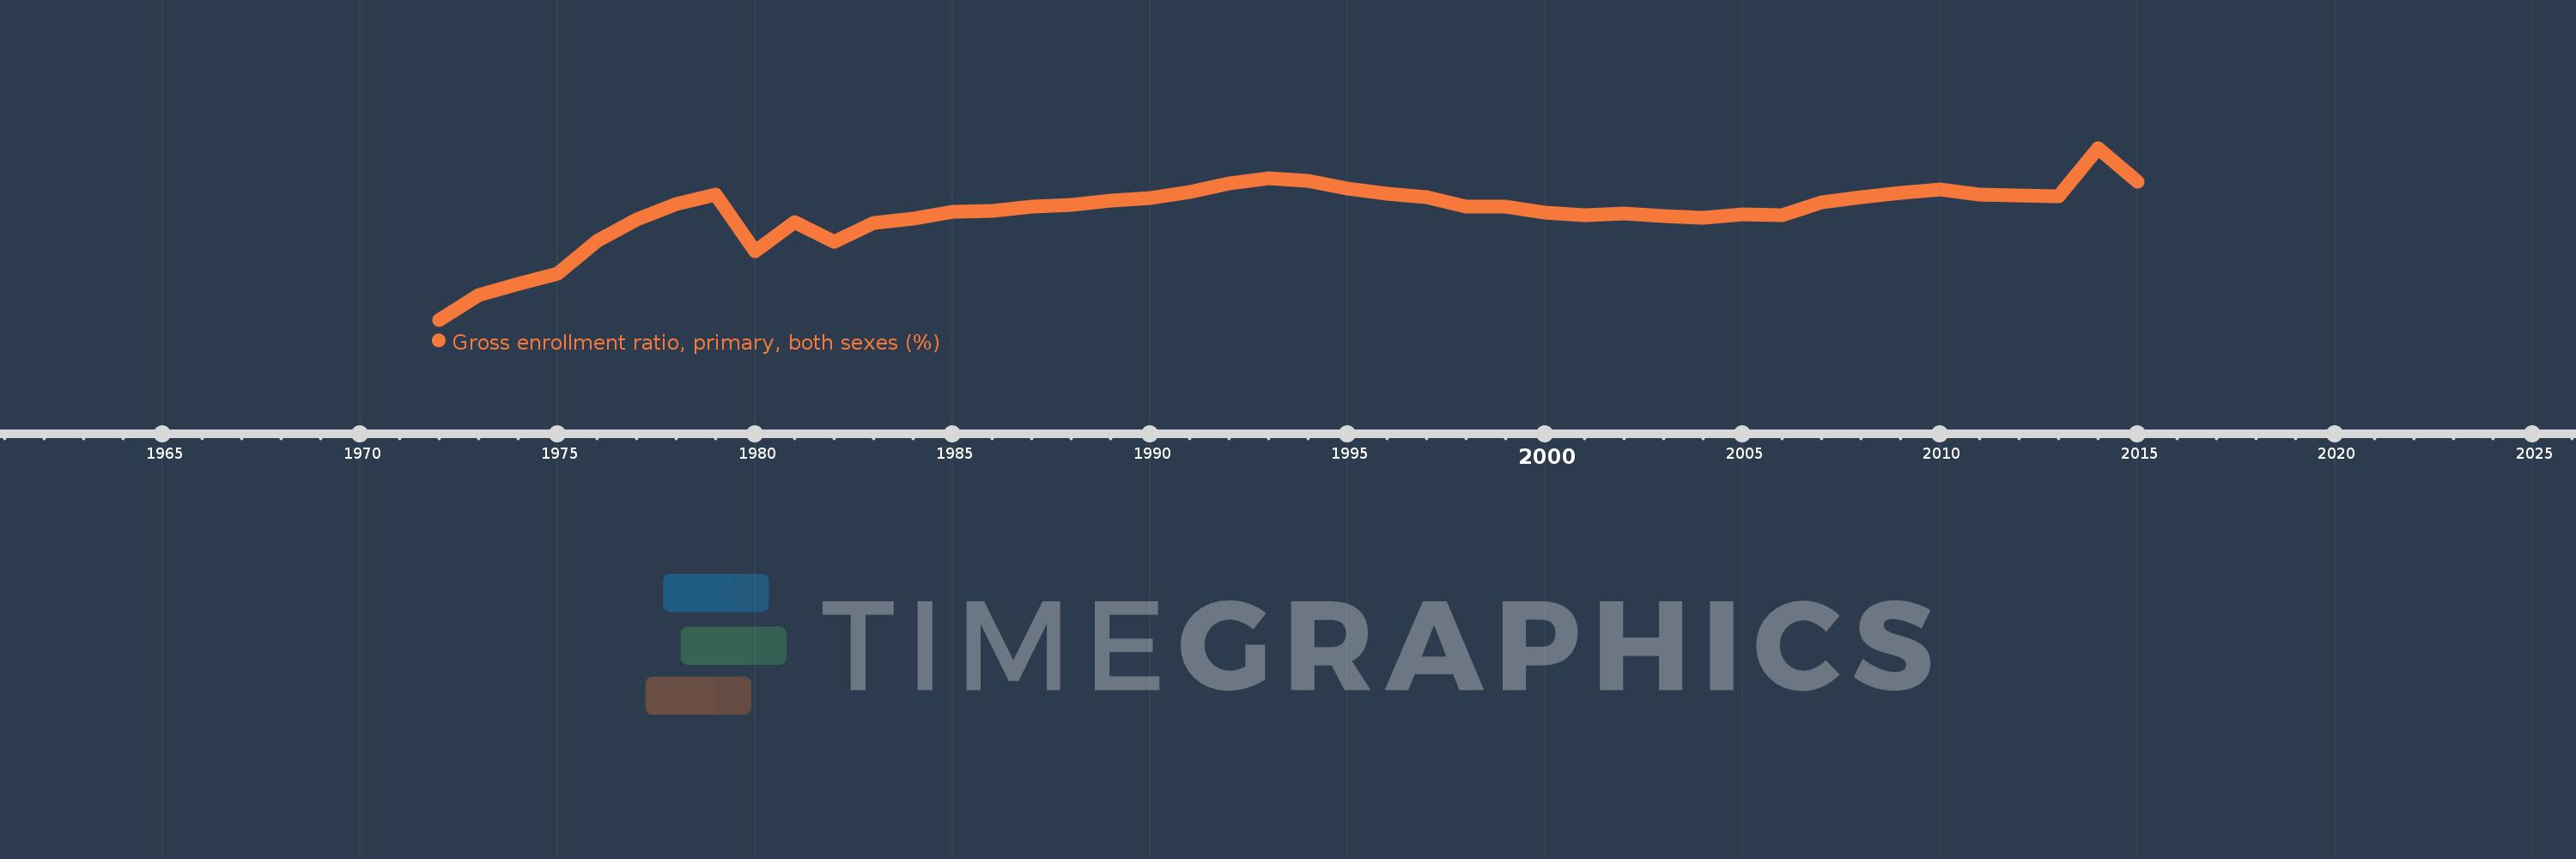
Gross enrollment ratio, primary, both sexes (%)
2015,2014,2013,2012,2011,2010,2009,2008,2007,2006,2005,2004,2003,2002,2001,2000,1999,1998,1997,1996,1995,1994,1993,1992,1991,1990,1989,1988,1987,1986,1985,1984,1983,1982,1981,1980,1979,1978,1977,1976,1975,1974,1973,1972
This statistics in other country:
AfghanistanAlbaniaAlgeriaAndorraAngolaAntigua and BarbudaArab WorldArgentinaArmeniaArubaAustraliaAustriaAzerbaijanBahamas, TheBahrainBangladeshBarbadosBelarusBelgiumBelizeBeninBermudaBhutanBoliviaBosnia and HerzegovinaBotswanaBrazilBritish Virgin IslandsBrunei DarussalamBulgariaBurkina FasoBurundiCabo VerdeCambodiaCameroonCanadaCaribbean small statesCentral African RepublicCentral Europe and the BalticsChadChileChinaColombiaComorosCongo, Dem. Rep.Congo, Rep.Costa RicaCote d'IvoireCroatiaCubaCuracaoCyprusCzech RepublicDenmarkDjiboutiDominicaDominican RepublicEarly-demographic dividendEast Asia & PacificEast Asia & Pacific (excluding high income)East Asia & Pacific (IDA & IBRD countries)EcuadorEgypt, Arab Rep.El SalvadorEquatorial GuineaEritreaEstoniaEthiopiaEuro areaEurope & Central AsiaEurope & Central Asia (excluding high income)Europe & Central Asia (IDA & IBRD countries)European UnionFijiFinlandFragile and conflict affected situationsFranceGabonGambia, TheGeorgiaGermanyGhanaGreeceGrenadaGuatemalaGuineaGuinea-BissauGuyanaHaitiHeavily indebted poor countries (HIPC)High incomeHondurasHong Kong SAR, ChinaHungaryIBRD onlyIcelandIDA & IBRD totalIDA blendIDA onlyIDA totalIndiaIndonesiaIran, Islamic Rep.IraqIrelandIsraelItalyJamaicaJapanJordanKazakhstanKenyaKiribatiKorea, Dem. People’s Rep.Korea, Rep.KuwaitKyrgyz RepublicLao PDRLate-demographic dividendLatin America & Caribbean Latin America & Caribbean (excluding high income)Latin America & the Caribbean (IDA & IBRD countries)LatviaLeast developed countries: UN classificationLebanonLesothoLiberiaLibyaLiechtensteinLithuaniaLow & middle incomeLow incomeLower middle incomeLuxembourgMacao SAR, ChinaMacedonia, FYRMadagascarMalawiMalaysiaMaldivesMaliMaltaMarshall IslandsMauritaniaMauritiusMexicoMicronesia, Fed. Sts.Middle East & North AfricaMiddle East & North Africa (excluding high income)Middle East & North Africa (IDA & IBRD countries)Middle incomeMoldovaMongoliaMontenegroMoroccoMozambiqueMyanmarNamibiaNauruNepalNetherlandsNew ZealandNicaraguaNigerNigeriaNorth AmericaNorwayOECD membersOmanOther small statesPacific island small statesPakistanPalauPanamaPapua New GuineaParaguayPeruPhilippinesPolandPortugalPost-demographic dividendPre-demographic dividendPuerto RicoQatarRomaniaRussian FederationRwandaSamoaSan MarinoSao Tome and PrincipeSaudi ArabiaSenegalSerbiaSeychellesSierra LeoneSlovak RepublicSloveniaSmall statesSolomon IslandsSomaliaSouth AfricaSouth AsiaSouth Asia (IDA & IBRD)South SudanSpainSri LankaSt. Kitts and NevisSt. LuciaSt. Vincent and the GrenadinesSub-Saharan Africa Sub-Saharan Africa (excluding high income)Sub-Saharan Africa (IDA & IBRD countries)SudanSurinameSwazilandSwedenSwitzerlandSyrian Arab RepublicTajikistanTanzaniaThailandTimor-LesteTogoTongaTrinidad and TobagoTunisiaTurkeyTurkmenistanTuvaluUgandaUkraineUnited Arab EmiratesUnited KingdomUnited StatesUpper middle incomeUruguayUzbekistanVanuatuVenezuela, RBVietnamWest Bank and GazaWorldYemen, Rep.ZambiaZimbabwe Timeline:
This timeline shows a graph from 1972 to 2015 of Iran, Islamic Rep.. No data until 1971. Number of actual observations by date: 44.
Source name:
World Development Indicators
Source organization:
UNESCO Institute for Statistics
Categories, topics:
Education
Last updated:
apr 23, 2017
Indicators value changes by year
Maximum:
118.396
jan 1, 2014
At the date of observation
Value
Absolute change
Change from previous value
jan 1, 1972
71.66
+71.66
0.0%
jan 1, 1973
78.29
+6.63
9.25%
jan 1, 1974
81.513
+3.223
4.12%
jan 1, 1975
84.308
+2.795
3.43%
jan 1, 1976
93.2
+8.891
10.55%
jan 1, 1977
99.04
+5.84
6.27%
jan 1, 1978
103.063
+4.023
4.06%
jan 1, 1979
105.761
+2.698
2.62%
jan 1, 1980
90.17
-15.591
-14.74%
jan 1, 1981
98.345
+8.175
9.07%
jan 1, 1982
92.879
-5.467
-5.56%
jan 1, 1983
98.105
+5.226
5.63%
jan 1, 1984
99.15
+1.045
1.07%
jan 1, 1985
100.993
+1.844
1.86%
jan 1, 1986
101.179
+0.186
0.18%
jan 1, 1987
102.342
+1.164
1.15%
jan 1, 1988
102.866
+0.524
0.51%
jan 1, 1989
104.012
+1.145
1.11%
jan 1, 1990
104.696
+0.685
0.66%
jan 1, 1991
106.339
+1.643
1.57%
jan 1, 1992
108.817
+2.477
2.33%
jan 1, 1993
110.138
+1.321
1.21%
jan 1, 1994
109.4
-0.738
-0.67%
jan 1, 1995
107.37
-2.03
-1.86%
jan 1, 1996
105.978
-1.392
-1.3%
jan 1, 1997
105.053
-0.925
-0.87%
jan 1, 1998
102.451
-2.602
-2.48%
jan 1, 1999
102.508
+0.057
0.06%
jan 1, 2000
100.829
-1.679
-1.64%
jan 1, 2001
100.086
-0.743
-0.74%
jan 1, 2002
100.457
+0.371
0.37%
jan 1, 2003
99.972
-0.485
-0.48%
jan 1, 2004
99.409
-0.563
-0.56%
jan 1, 2005
100.316
+0.907
0.91%
jan 1, 2006
100.084
-0.232
-0.23%
jan 1, 2007
103.695
+3.61
3.61%
jan 1, 2008
104.896
+1.202
1.16%
jan 1, 2009
106.158
+1.262
1.2%
jan 1, 2010
107.124
+0.965
0.91%
jan 1, 2011
105.762
-1.362
-1.27%
jan 1, 2012
105.404
-0.357
-0.34%
jan 1, 2013
105.282
-0.122
-0.12%
jan 1, 2014
118.396
+13.114
12.46%
jan 1, 2015
109.184
-9.212
-7.78%
Ranking of countries by current statistics by years


Comments: