29
/
en
AIzaSyAYiBZKx7MnpbEhh9jyipgxe19OcubqV5w
April 1, 2024
40742
Late-demographic dividend
LTE
false
2
1
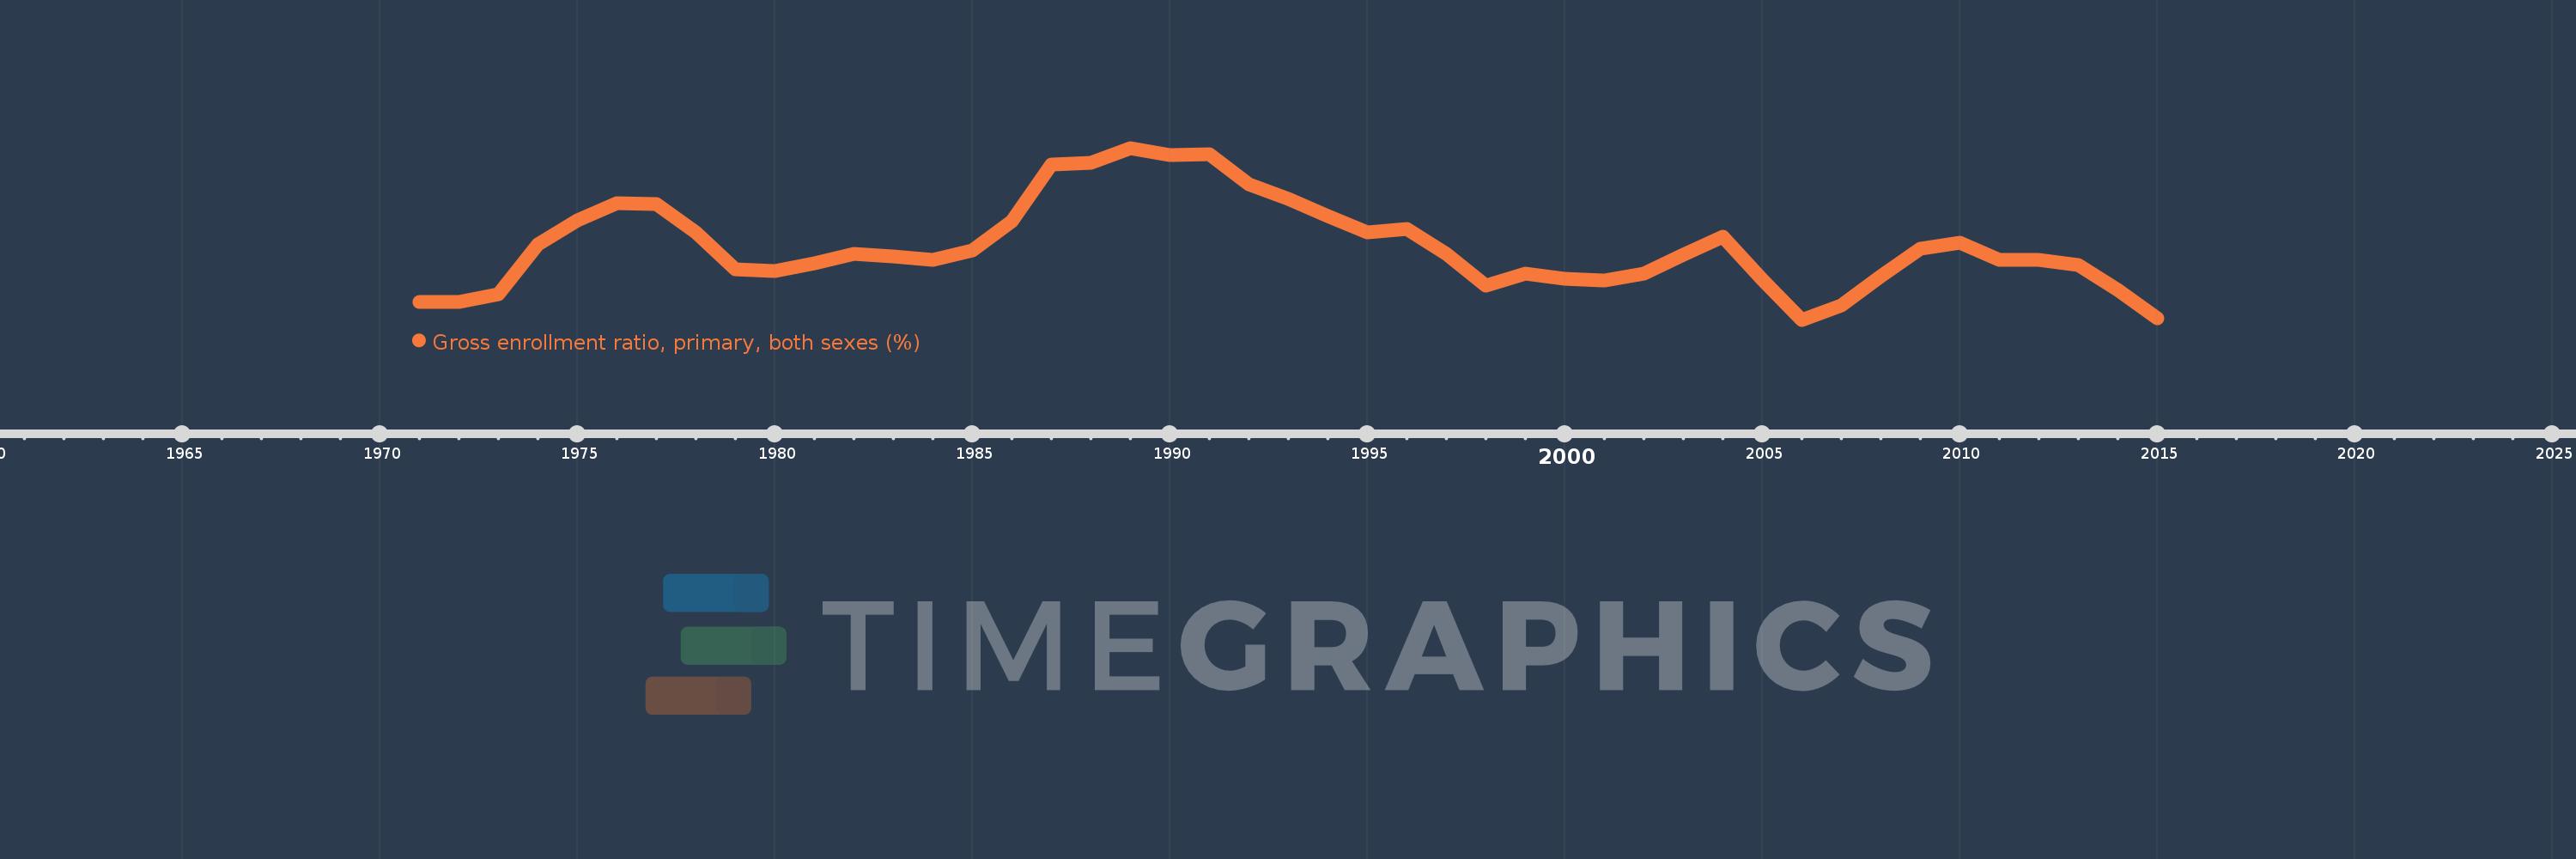
Gross enrollment ratio, primary, both sexes (%)
2015,2014,2013,2012,2011,2010,2009,2008,2007,2006,2005,2004,2003,2002,2001,2000,1999,1998,1997,1996,1995,1994,1993,1992,1991,1990,1989,1988,1987,1986,1985,1984,1983,1982,1981,1980,1979,1978,1977,1976,1975,1974,1973,1972,1971
This statistics in other country:
AfghanistanAlbaniaAlgeriaAndorraAngolaAntigua and BarbudaArab WorldArgentinaArmeniaArubaAustraliaAustriaAzerbaijanBahamas, TheBahrainBangladeshBarbadosBelarusBelgiumBelizeBeninBermudaBhutanBoliviaBosnia and HerzegovinaBotswanaBrazilBritish Virgin IslandsBrunei DarussalamBulgariaBurkina FasoBurundiCabo VerdeCambodiaCameroonCanadaCaribbean small statesCentral African RepublicCentral Europe and the BalticsChadChileChinaColombiaComorosCongo, Dem. Rep.Congo, Rep.Costa RicaCote d'IvoireCroatiaCubaCuracaoCyprusCzech RepublicDenmarkDjiboutiDominicaDominican RepublicEarly-demographic dividendEast Asia & PacificEast Asia & Pacific (excluding high income)East Asia & Pacific (IDA & IBRD countries)EcuadorEgypt, Arab Rep.El SalvadorEquatorial GuineaEritreaEstoniaEthiopiaEuro areaEurope & Central AsiaEurope & Central Asia (excluding high income)Europe & Central Asia (IDA & IBRD countries)European UnionFijiFinlandFragile and conflict affected situationsFranceGabonGambia, TheGeorgiaGermanyGhanaGreeceGrenadaGuatemalaGuineaGuinea-BissauGuyanaHaitiHeavily indebted poor countries (HIPC)High incomeHondurasHong Kong SAR, ChinaHungaryIBRD onlyIcelandIDA & IBRD totalIDA blendIDA onlyIDA totalIndiaIndonesiaIran, Islamic Rep.IraqIrelandIsraelItalyJamaicaJapanJordanKazakhstanKenyaKiribatiKorea, Dem. People’s Rep.Korea, Rep.KuwaitKyrgyz RepublicLao PDRLate-demographic dividendLatin America & Caribbean Latin America & Caribbean (excluding high income)Latin America & the Caribbean (IDA & IBRD countries)LatviaLeast developed countries: UN classificationLebanonLesothoLiberiaLibyaLiechtensteinLithuaniaLow & middle incomeLow incomeLower middle incomeLuxembourgMacao SAR, ChinaMacedonia, FYRMadagascarMalawiMalaysiaMaldivesMaliMaltaMarshall IslandsMauritaniaMauritiusMexicoMicronesia, Fed. Sts.Middle East & North AfricaMiddle East & North Africa (excluding high income)Middle East & North Africa (IDA & IBRD countries)Middle incomeMoldovaMongoliaMontenegroMoroccoMozambiqueMyanmarNamibiaNauruNepalNetherlandsNew ZealandNicaraguaNigerNigeriaNorth AmericaNorwayOECD membersOmanOther small statesPacific island small statesPakistanPalauPanamaPapua New GuineaParaguayPeruPhilippinesPolandPortugalPost-demographic dividendPre-demographic dividendPuerto RicoQatarRomaniaRussian FederationRwandaSamoaSan MarinoSao Tome and PrincipeSaudi ArabiaSenegalSerbiaSeychellesSierra LeoneSlovak RepublicSloveniaSmall statesSolomon IslandsSomaliaSouth AfricaSouth AsiaSouth Asia (IDA & IBRD)South SudanSpainSri LankaSt. Kitts and NevisSt. LuciaSt. Vincent and the GrenadinesSub-Saharan Africa Sub-Saharan Africa (excluding high income)Sub-Saharan Africa (IDA & IBRD countries)SudanSurinameSwazilandSwedenSwitzerlandSyrian Arab RepublicTajikistanTanzaniaThailandTimor-LesteTogoTongaTrinidad and TobagoTunisiaTurkeyTurkmenistanTuvaluUgandaUkraineUnited Arab EmiratesUnited KingdomUnited StatesUpper middle incomeUruguayUzbekistanVanuatuVenezuela, RBVietnamWest Bank and GazaWorldYemen, Rep.ZambiaZimbabwe Timeline:
This timeline shows a graph from 1971 to 2015 of Late-demographic dividend. No data until 1970. Number of actual observations by date: 45.
Source name:
World Development Indicators
Source organization:
UNESCO Institute for Statistics
Categories, topics:
Education
Last updated:
apr 23, 2017
Indicators value changes by year
Minimum:
104.806
jan 1, 2006
Maximum:
121.776
jan 1, 1989
At the date of observation
Value
Absolute change
Change from previous value
jan 1, 1971
106.581
+106.581
0.0%
jan 1, 1972
106.548
-0.033
-0.03%
jan 1, 1973
107.356
+0.808
0.76%
jan 1, 1974
112.222
+4.867
4.53%
jan 1, 1975
114.652
+2.43
2.16%
jan 1, 1976
116.285
+1.633
1.42%
jan 1, 1977
116.231
-0.054
-0.05%
jan 1, 1978
113.418
-2.813
-2.42%
jan 1, 1979
109.762
-3.656
-3.22%
jan 1, 1980
109.575
-0.186
-0.17%
jan 1, 1981
110.401
+0.825
0.75%
jan 1, 1982
111.274
+0.873
0.79%
jan 1, 1983
111.1
-0.174
-0.16%
jan 1, 1984
110.762
-0.338
-0.3%
jan 1, 1985
111.625
+0.863
0.78%
jan 1, 1986
114.525
+2.9
2.6%
jan 1, 1987
120.158
+5.633
4.92%
jan 1, 1988
120.269
+0.111
0.09%
jan 1, 1989
121.776
+1.507
1.25%
jan 1, 1990
121.048
-0.727
-0.6%
jan 1, 1991
121.191
+0.142
0.12%
jan 1, 1992
118.193
-2.997
-2.47%
jan 1, 1993
116.729
-1.465
-1.24%
jan 1, 1994
115.044
-1.685
-1.44%
jan 1, 1995
113.421
-1.623
-1.41%
jan 1, 1996
113.791
+0.37
0.33%
jan 1, 1997
111.278
-2.513
-2.21%
jan 1, 1998
108.206
-3.073
-2.76%
jan 1, 1999
109.403
+1.198
1.11%
jan 1, 2000
108.832
-0.571
-0.52%
jan 1, 2001
108.669
-0.164
-0.15%
jan 1, 2002
109.399
+0.731
0.67%
jan 1, 2003
111.227
+1.827
1.67%
jan 1, 2004
113.042
+1.815
1.63%
jan 1, 2005
108.802
-4.239
-3.75%
jan 1, 2006
104.806
-3.997
-3.67%
jan 1, 2007
106.194
+1.388
1.32%
jan 1, 2008
109.1
+2.907
2.74%
jan 1, 2009
111.829
+2.729
2.5%
jan 1, 2010
112.438
+0.609
0.54%
jan 1, 2011
110.702
-1.736
-1.54%
jan 1, 2012
110.754
+0.053
0.05%
jan 1, 2013
110.213
-0.542
-0.49%
jan 1, 2014
107.712
-2.5
-2.27%
jan 1, 2015
104.981
-2.731
-2.54%
Ranking of countries by current statistics by years


Comments: