29
/
en
AIzaSyAYiBZKx7MnpbEhh9jyipgxe19OcubqV5w
April 1, 2024
167546
Kenya
KEN
true
2
1
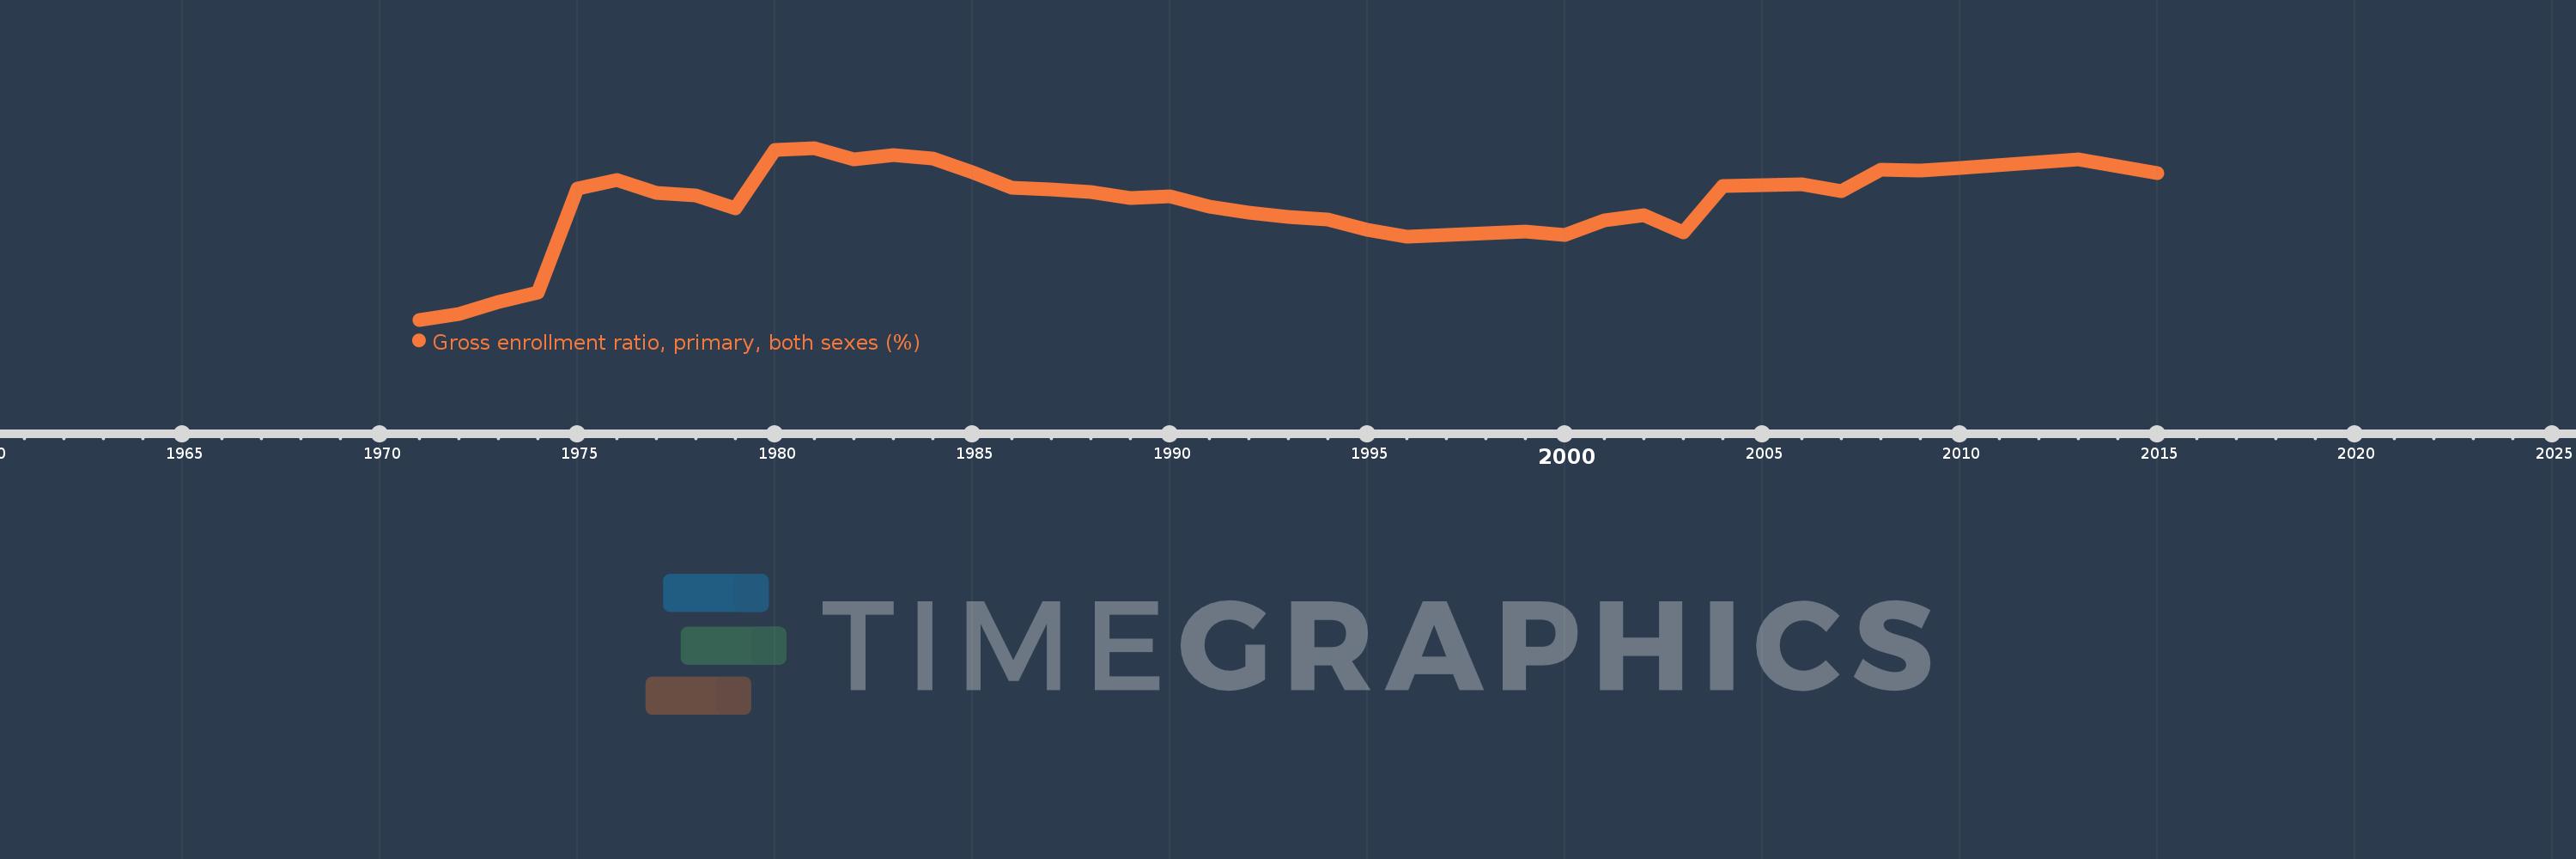
Gross enrollment ratio, primary, both sexes (%)
2015,2013,2010,2009,2008,2007,2006,2005,2004,2003,2002,2001,2000,1999,1996,1995,1994,1993,1992,1991,1990,1989,1988,1987,1986,1985,1984,1983,1982,1981,1980,1979,1978,1977,1976,1975,1974,1973,1972,1971
This statistics in other country:
AfghanistanAlbaniaAlgeriaAndorraAngolaAntigua and BarbudaArab WorldArgentinaArmeniaArubaAustraliaAustriaAzerbaijanBahamas, TheBahrainBangladeshBarbadosBelarusBelgiumBelizeBeninBermudaBhutanBoliviaBosnia and HerzegovinaBotswanaBrazilBritish Virgin IslandsBrunei DarussalamBulgariaBurkina FasoBurundiCabo VerdeCambodiaCameroonCanadaCaribbean small statesCentral African RepublicCentral Europe and the BalticsChadChileChinaColombiaComorosCongo, Dem. Rep.Congo, Rep.Costa RicaCote d'IvoireCroatiaCubaCuracaoCyprusCzech RepublicDenmarkDjiboutiDominicaDominican RepublicEarly-demographic dividendEast Asia & PacificEast Asia & Pacific (excluding high income)East Asia & Pacific (IDA & IBRD countries)EcuadorEgypt, Arab Rep.El SalvadorEquatorial GuineaEritreaEstoniaEthiopiaEuro areaEurope & Central AsiaEurope & Central Asia (excluding high income)Europe & Central Asia (IDA & IBRD countries)European UnionFijiFinlandFragile and conflict affected situationsFranceGabonGambia, TheGeorgiaGermanyGhanaGreeceGrenadaGuatemalaGuineaGuinea-BissauGuyanaHaitiHeavily indebted poor countries (HIPC)High incomeHondurasHong Kong SAR, ChinaHungaryIBRD onlyIcelandIDA & IBRD totalIDA blendIDA onlyIDA totalIndiaIndonesiaIran, Islamic Rep.IraqIrelandIsraelItalyJamaicaJapanJordanKazakhstanKenyaKiribatiKorea, Dem. People’s Rep.Korea, Rep.KuwaitKyrgyz RepublicLao PDRLate-demographic dividendLatin America & Caribbean Latin America & Caribbean (excluding high income)Latin America & the Caribbean (IDA & IBRD countries)LatviaLeast developed countries: UN classificationLebanonLesothoLiberiaLibyaLiechtensteinLithuaniaLow & middle incomeLow incomeLower middle incomeLuxembourgMacao SAR, ChinaMacedonia, FYRMadagascarMalawiMalaysiaMaldivesMaliMaltaMarshall IslandsMauritaniaMauritiusMexicoMicronesia, Fed. Sts.Middle East & North AfricaMiddle East & North Africa (excluding high income)Middle East & North Africa (IDA & IBRD countries)Middle incomeMoldovaMongoliaMontenegroMoroccoMozambiqueMyanmarNamibiaNauruNepalNetherlandsNew ZealandNicaraguaNigerNigeriaNorth AmericaNorwayOECD membersOmanOther small statesPacific island small statesPakistanPalauPanamaPapua New GuineaParaguayPeruPhilippinesPolandPortugalPost-demographic dividendPre-demographic dividendPuerto RicoQatarRomaniaRussian FederationRwandaSamoaSan MarinoSao Tome and PrincipeSaudi ArabiaSenegalSerbiaSeychellesSierra LeoneSlovak RepublicSloveniaSmall statesSolomon IslandsSomaliaSouth AfricaSouth AsiaSouth Asia (IDA & IBRD)South SudanSpainSri LankaSt. Kitts and NevisSt. LuciaSt. Vincent and the GrenadinesSub-Saharan Africa Sub-Saharan Africa (excluding high income)Sub-Saharan Africa (IDA & IBRD countries)SudanSurinameSwazilandSwedenSwitzerlandSyrian Arab RepublicTajikistanTanzaniaThailandTimor-LesteTogoTongaTrinidad and TobagoTunisiaTurkeyTurkmenistanTuvaluUgandaUkraineUnited Arab EmiratesUnited KingdomUnited StatesUpper middle incomeUruguayUzbekistanVanuatuVenezuela, RBVietnamWest Bank and GazaWorldYemen, Rep.ZambiaZimbabwe Timeline:
This timeline shows a graph from 1971 to 2015 of Kenya. No data until 1970. Number of actual observations by date: 40.
Source name:
World Development Indicators
Source organization:
UNESCO Institute for Statistics
Categories, topics:
Education
Last updated:
apr 23, 2017
Indicators value changes by year
Minimum:
62.823
jan 1, 1971
Maximum:
119.876
jan 1, 1981
At the date of observation
Value
Absolute change
Change from previous value
jan 1, 1971
62.823
+62.823
0.0%
jan 1, 1972
64.684
+1.862
2.96%
jan 1, 1973
68.683
+3.998
6.18%
jan 1, 1974
71.799
+3.116
4.54%
jan 1, 1975
106.338
+34.539
48.11%
jan 1, 1976
109.293
+2.955
2.78%
jan 1, 1977
105.028
-4.265
-3.9%
jan 1, 1978
104.074
-0.954
-0.91%
jan 1, 1979
99.714
-4.359
-4.19%
jan 1, 1980
119.345
+19.631
19.69%
jan 1, 1981
119.876
+0.53
0.44%
jan 1, 1982
116.065
-3.811
-3.18%
jan 1, 1983
117.469
+1.404
1.21%
jan 1, 1984
116.507
-0.962
-0.82%
jan 1, 1985
111.759
-4.747
-4.07%
jan 1, 1986
106.574
-5.186
-4.64%
jan 1, 1987
106.016
-0.557
-0.52%
jan 1, 1988
105.308
-0.708
-0.67%
jan 1, 1989
103.321
-1.987
-1.89%
jan 1, 1990
103.888
+0.568
0.55%
jan 1, 1991
100.427
-3.461
-3.33%
jan 1, 1992
98.258
-2.169
-2.16%
jan 1, 1993
96.847
-1.412
-1.44%
jan 1, 1994
96.058
-0.789
-0.81%
jan 1, 1995
92.648
-3.41
-3.55%
jan 1, 1996
90.545
-2.103
-2.27%
jan 1, 1999
92.024
+1.479
1.63%
jan 1, 2000
90.885
-1.139
-1.24%
jan 1, 2001
95.688
+4.803
5.28%
jan 1, 2002
97.411
+1.723
1.8%
jan 1, 2003
91.91
-5.502
-5.65%
jan 1, 2004
107.371
+15.461
16.82%
jan 1, 2005
107.418
+0.048
0.04%
jan 1, 2006
107.678
+0.26
0.24%
jan 1, 2007
105.573
-2.105
-1.95%
jan 1, 2008
112.63
+7.056
6.68%
jan 1, 2009
112.302
-0.327
-0.29%
jan 1, 2010
113.268
+0.966
0.86%
jan 1, 2013
116.131
+2.863
2.53%
jan 1, 2015
111.396
-4.735
-4.08%
Ranking of countries by current statistics by years


Comments: