29
/
en
AIzaSyAYiBZKx7MnpbEhh9jyipgxe19OcubqV5w
April 1, 2024
238310
Seychelles
SYC
true
2
1
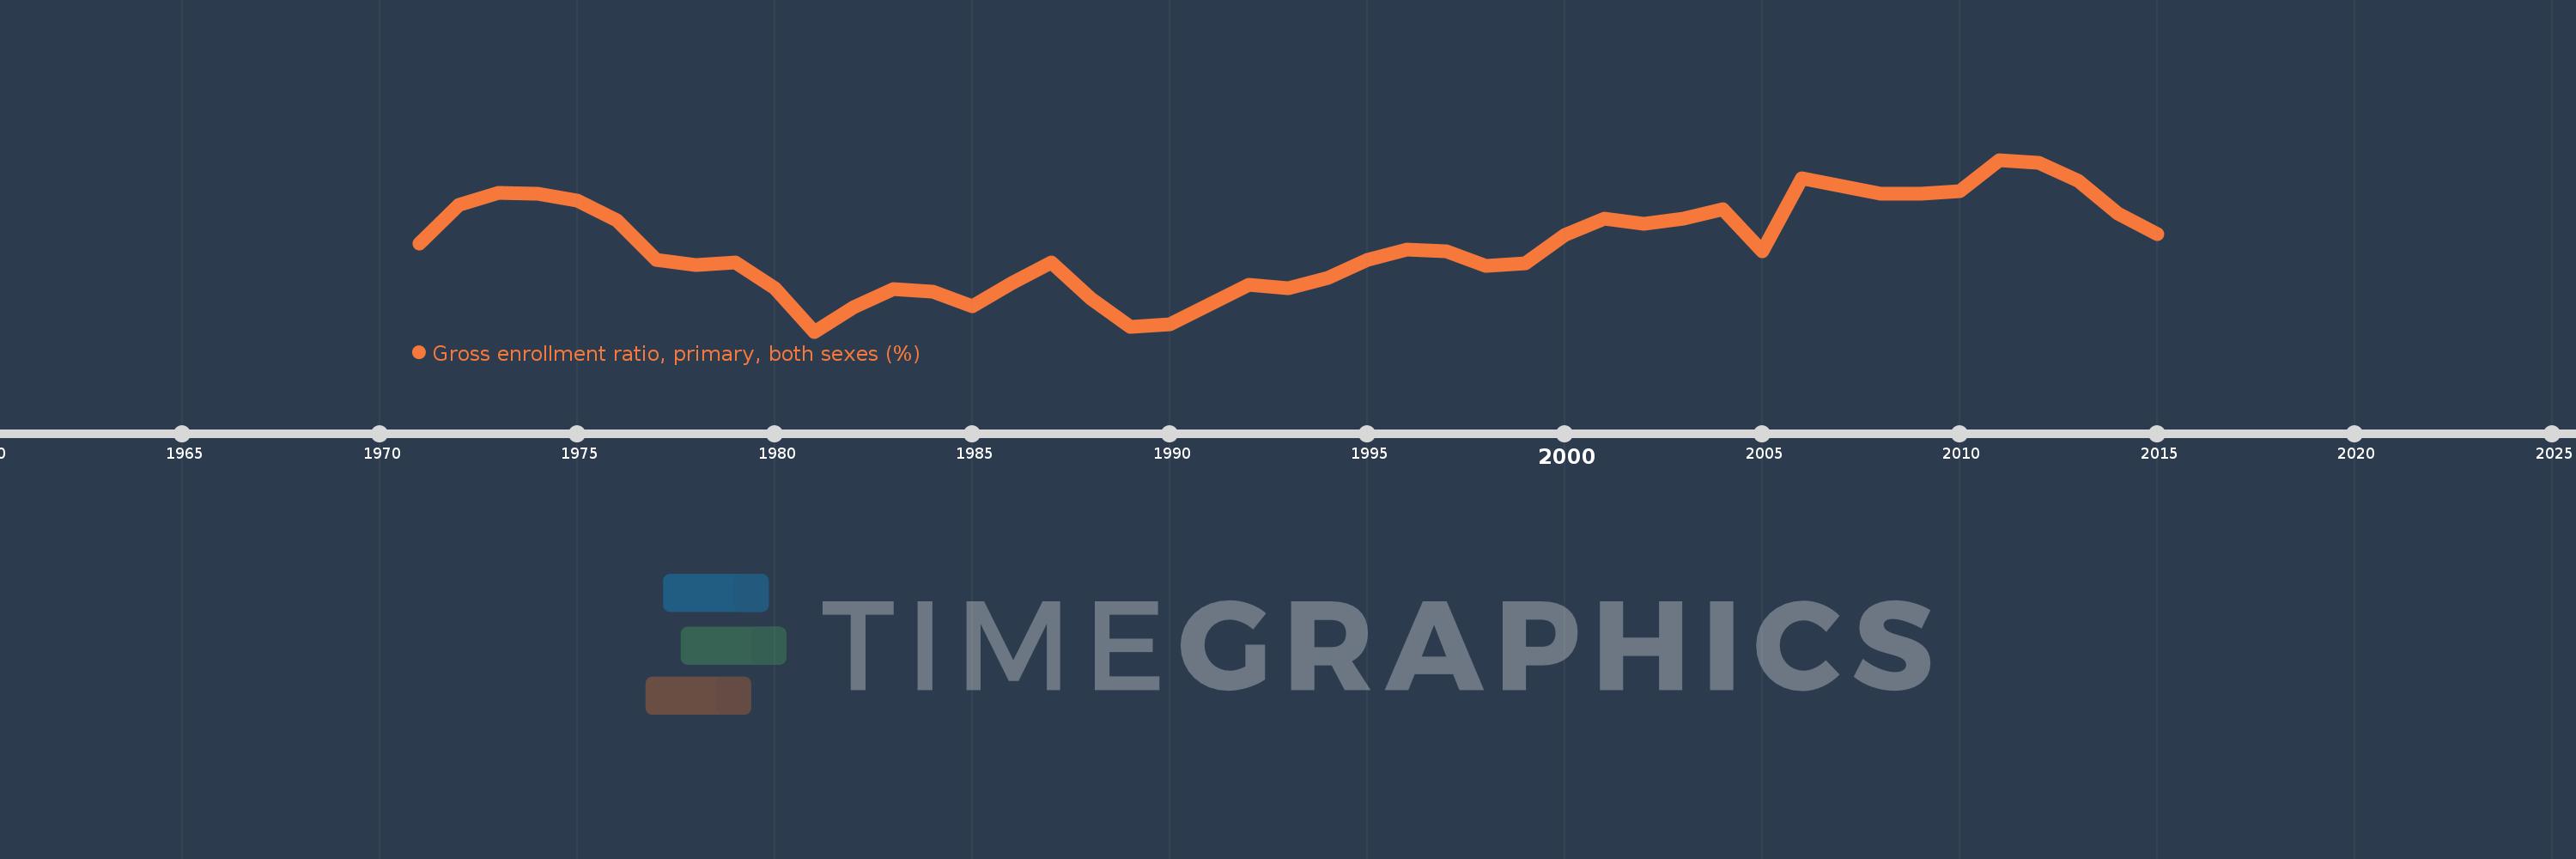
Gross enrollment ratio, primary, both sexes (%)
2015,2014,2013,2012,2011,2010,2009,2008,2006,2005,2004,2003,2002,2001,2000,1999,1998,1997,1996,1995,1994,1993,1992,1990,1989,1988,1987,1986,1985,1984,1983,1982,1981,1980,1979,1978,1977,1976,1975,1974,1973,1972,1971
This statistics in other country:
AfghanistanAlbaniaAlgeriaAndorraAngolaAntigua and BarbudaArab WorldArgentinaArmeniaArubaAustraliaAustriaAzerbaijanBahamas, TheBahrainBangladeshBarbadosBelarusBelgiumBelizeBeninBermudaBhutanBoliviaBosnia and HerzegovinaBotswanaBrazilBritish Virgin IslandsBrunei DarussalamBulgariaBurkina FasoBurundiCabo VerdeCambodiaCameroonCanadaCaribbean small statesCentral African RepublicCentral Europe and the BalticsChadChileChinaColombiaComorosCongo, Dem. Rep.Congo, Rep.Costa RicaCote d'IvoireCroatiaCubaCuracaoCyprusCzech RepublicDenmarkDjiboutiDominicaDominican RepublicEarly-demographic dividendEast Asia & PacificEast Asia & Pacific (excluding high income)East Asia & Pacific (IDA & IBRD countries)EcuadorEgypt, Arab Rep.El SalvadorEquatorial GuineaEritreaEstoniaEthiopiaEuro areaEurope & Central AsiaEurope & Central Asia (excluding high income)Europe & Central Asia (IDA & IBRD countries)European UnionFijiFinlandFragile and conflict affected situationsFranceGabonGambia, TheGeorgiaGermanyGhanaGreeceGrenadaGuatemalaGuineaGuinea-BissauGuyanaHaitiHeavily indebted poor countries (HIPC)High incomeHondurasHong Kong SAR, ChinaHungaryIBRD onlyIcelandIDA & IBRD totalIDA blendIDA onlyIDA totalIndiaIndonesiaIran, Islamic Rep.IraqIrelandIsraelItalyJamaicaJapanJordanKazakhstanKenyaKiribatiKorea, Dem. People’s Rep.Korea, Rep.KuwaitKyrgyz RepublicLao PDRLate-demographic dividendLatin America & Caribbean Latin America & Caribbean (excluding high income)Latin America & the Caribbean (IDA & IBRD countries)LatviaLeast developed countries: UN classificationLebanonLesothoLiberiaLibyaLiechtensteinLithuaniaLow & middle incomeLow incomeLower middle incomeLuxembourgMacao SAR, ChinaMacedonia, FYRMadagascarMalawiMalaysiaMaldivesMaliMaltaMarshall IslandsMauritaniaMauritiusMexicoMicronesia, Fed. Sts.Middle East & North AfricaMiddle East & North Africa (excluding high income)Middle East & North Africa (IDA & IBRD countries)Middle incomeMoldovaMongoliaMontenegroMoroccoMozambiqueMyanmarNamibiaNauruNepalNetherlandsNew ZealandNicaraguaNigerNigeriaNorth AmericaNorwayOECD membersOmanOther small statesPacific island small statesPakistanPalauPanamaPapua New GuineaParaguayPeruPhilippinesPolandPortugalPost-demographic dividendPre-demographic dividendPuerto RicoQatarRomaniaRussian FederationRwandaSamoaSan MarinoSao Tome and PrincipeSaudi ArabiaSenegalSerbiaSeychellesSierra LeoneSlovak RepublicSloveniaSmall statesSolomon IslandsSomaliaSouth AfricaSouth AsiaSouth Asia (IDA & IBRD)South SudanSpainSri LankaSt. Kitts and NevisSt. LuciaSt. Vincent and the GrenadinesSub-Saharan Africa Sub-Saharan Africa (excluding high income)Sub-Saharan Africa (IDA & IBRD countries)SudanSurinameSwazilandSwedenSwitzerlandSyrian Arab RepublicTajikistanTanzaniaThailandTimor-LesteTogoTongaTrinidad and TobagoTunisiaTurkeyTurkmenistanTuvaluUgandaUkraineUnited Arab EmiratesUnited KingdomUnited StatesUpper middle incomeUruguayUzbekistanVanuatuVenezuela, RBVietnamWest Bank and GazaWorldYemen, Rep.ZambiaZimbabwe Timeline:
This timeline shows a graph from 1971 to 2015 of Seychelles. No data until 1970. Number of actual observations by date: 43.
Source name:
World Development Indicators
Source organization:
UNESCO Institute for Statistics
Categories, topics:
Education
Last updated:
apr 23, 2017
Indicators value changes by year
Maximum:
110.671
jan 1, 2011
At the date of observation
Value
Absolute change
Change from previous value
jan 1, 1971
103.373
+103.373
0.0%
jan 1, 1972
106.689
+3.315
3.21%
jan 1, 1973
107.755
+1.066
1.0%
jan 1, 1974
107.738
-0.017
-0.02%
jan 1, 1975
107.128
-0.61
-0.57%
jan 1, 1976
105.376
-1.752
-1.64%
jan 1, 1977
101.874
-3.502
-3.32%
jan 1, 1978
101.481
-0.392
-0.38%
jan 1, 1979
101.708
+0.227
0.22%
jan 1, 1980
99.462
-2.246
-2.21%
jan 1, 1981
95.63
-3.832
-3.85%
jan 1, 1982
97.744
+2.113
2.21%
jan 1, 1983
99.318
+1.574
1.61%
jan 1, 1984
99.152
-0.166
-0.17%
jan 1, 1985
97.881
-1.271
-1.28%
jan 1, 1986
99.897
+2.016
2.06%
jan 1, 1987
101.702
+1.805
1.81%
jan 1, 1988
98.501
-3.2
-3.15%
jan 1, 1989
96.012
-2.489
-2.53%
jan 1, 1990
96.236
+0.224
0.23%
jan 1, 1992
99.734
+3.498
3.63%
jan 1, 1993
99.449
-0.285
-0.29%
jan 1, 1994
100.295
+0.845
0.85%
jan 1, 1995
101.944
+1.649
1.64%
jan 1, 1996
102.776
+0.832
0.82%
jan 1, 1997
102.637
-0.139
-0.14%
jan 1, 1998
101.362
-1.275
-1.24%
jan 1, 1999
101.639
+0.276
0.27%
jan 1, 2000
104.077
+2.438
2.4%
jan 1, 2001
105.526
+1.45
1.39%
jan 1, 2002
105.047
-0.479
-0.45%
jan 1, 2003
105.515
+0.468
0.45%
jan 1, 2004
106.364
+0.848
0.8%
jan 1, 2005
102.651
-3.713
-3.49%
jan 1, 2006
109.065
+6.414
6.25%
jan 1, 2008
107.717
-1.348
-1.24%
jan 1, 2009
107.738
+0.021
0.02%
jan 1, 2010
107.921
+0.184
0.17%
jan 1, 2011
110.671
+2.75
2.55%
jan 1, 2012
110.399
-0.273
-0.25%
jan 1, 2013
108.844
-1.555
-1.41%
jan 1, 2014
105.981
-2.863
-2.63%
jan 1, 2015
104.148
-1.833
-1.73%
Ranking of countries by current statistics by years


Comments: