29
/
en
AIzaSyAYiBZKx7MnpbEhh9jyipgxe19OcubqV5w
April 1, 2024
166199
Kazakhstan
KAZ
true
2
1
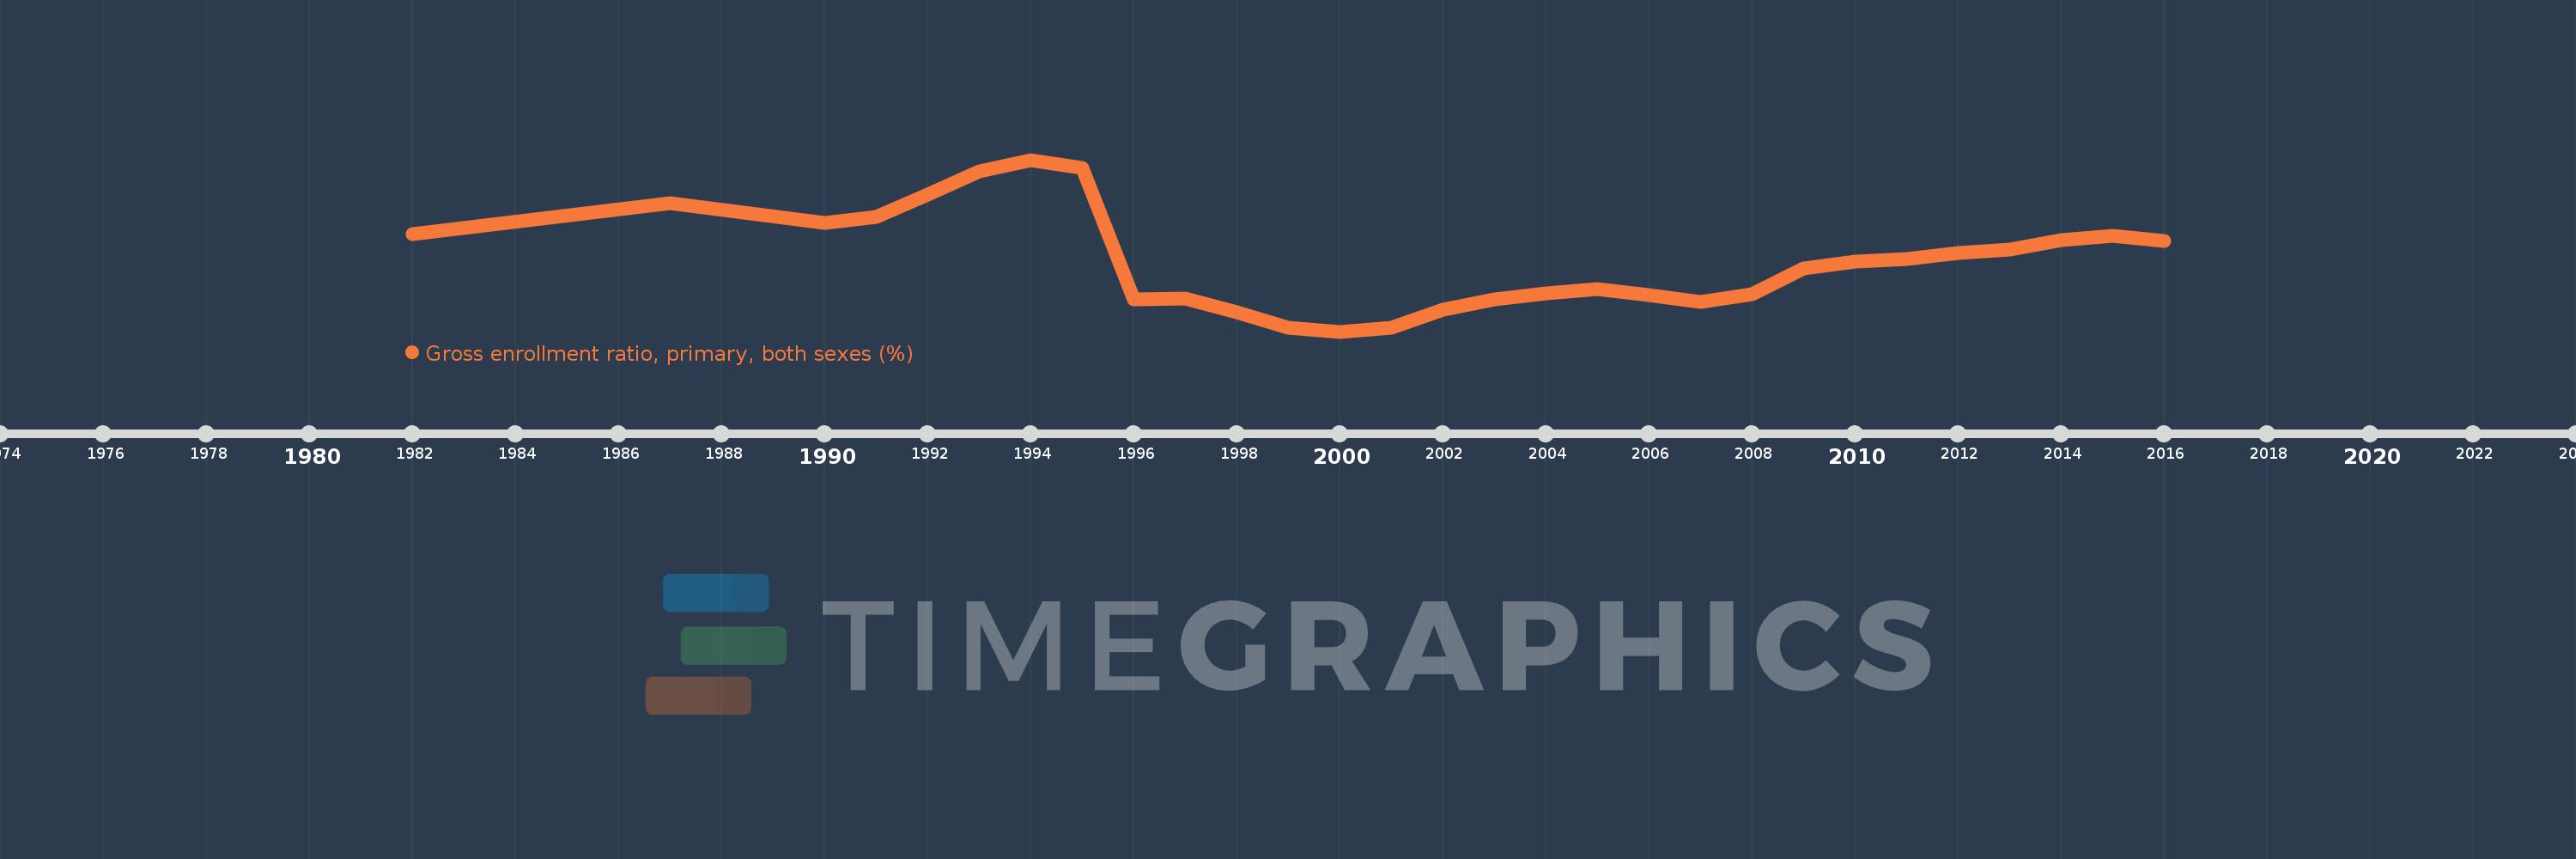
Gross enrollment ratio, primary, both sexes (%)
2016,2015,2014,2013,2012,2011,2010,2009,2008,2007,2006,2005,2004,2003,2002,2001,2000,1999,1998,1997,1996,1995,1994,1993,1992,1991,1990,1987,1982
This statistics in other country:
AfghanistanAlbaniaAlgeriaAndorraAngolaAntigua and BarbudaArab WorldArgentinaArmeniaArubaAustraliaAustriaAzerbaijanBahamas, TheBahrainBangladeshBarbadosBelarusBelgiumBelizeBeninBermudaBhutanBoliviaBosnia and HerzegovinaBotswanaBrazilBritish Virgin IslandsBrunei DarussalamBulgariaBurkina FasoBurundiCabo VerdeCambodiaCameroonCanadaCaribbean small statesCentral African RepublicCentral Europe and the BalticsChadChileChinaColombiaComorosCongo, Dem. Rep.Congo, Rep.Costa RicaCote d'IvoireCroatiaCubaCuracaoCyprusCzech RepublicDenmarkDjiboutiDominicaDominican RepublicEarly-demographic dividendEast Asia & PacificEast Asia & Pacific (excluding high income)East Asia & Pacific (IDA & IBRD countries)EcuadorEgypt, Arab Rep.El SalvadorEquatorial GuineaEritreaEstoniaEthiopiaEuro areaEurope & Central AsiaEurope & Central Asia (excluding high income)Europe & Central Asia (IDA & IBRD countries)European UnionFijiFinlandFragile and conflict affected situationsFranceGabonGambia, TheGeorgiaGermanyGhanaGreeceGrenadaGuatemalaGuineaGuinea-BissauGuyanaHaitiHeavily indebted poor countries (HIPC)High incomeHondurasHong Kong SAR, ChinaHungaryIBRD onlyIcelandIDA & IBRD totalIDA blendIDA onlyIDA totalIndiaIndonesiaIran, Islamic Rep.IraqIrelandIsraelItalyJamaicaJapanJordanKazakhstanKenyaKiribatiKorea, Dem. People’s Rep.Korea, Rep.KuwaitKyrgyz RepublicLao PDRLate-demographic dividendLatin America & Caribbean Latin America & Caribbean (excluding high income)Latin America & the Caribbean (IDA & IBRD countries)LatviaLeast developed countries: UN classificationLebanonLesothoLiberiaLibyaLiechtensteinLithuaniaLow & middle incomeLow incomeLower middle incomeLuxembourgMacao SAR, ChinaMacedonia, FYRMadagascarMalawiMalaysiaMaldivesMaliMaltaMarshall IslandsMauritaniaMauritiusMexicoMicronesia, Fed. Sts.Middle East & North AfricaMiddle East & North Africa (excluding high income)Middle East & North Africa (IDA & IBRD countries)Middle incomeMoldovaMongoliaMontenegroMoroccoMozambiqueMyanmarNamibiaNauruNepalNetherlandsNew ZealandNicaraguaNigerNigeriaNorth AmericaNorwayOECD membersOmanOther small statesPacific island small statesPakistanPalauPanamaPapua New GuineaParaguayPeruPhilippinesPolandPortugalPost-demographic dividendPre-demographic dividendPuerto RicoQatarRomaniaRussian FederationRwandaSamoaSan MarinoSao Tome and PrincipeSaudi ArabiaSenegalSerbiaSeychellesSierra LeoneSlovak RepublicSloveniaSmall statesSolomon IslandsSomaliaSouth AfricaSouth AsiaSouth Asia (IDA & IBRD)South SudanSpainSri LankaSt. Kitts and NevisSt. LuciaSt. Vincent and the GrenadinesSub-Saharan Africa Sub-Saharan Africa (excluding high income)Sub-Saharan Africa (IDA & IBRD countries)SudanSurinameSwazilandSwedenSwitzerlandSyrian Arab RepublicTajikistanTanzaniaThailandTimor-LesteTogoTongaTrinidad and TobagoTunisiaTurkeyTurkmenistanTuvaluUgandaUkraineUnited Arab EmiratesUnited KingdomUnited StatesUpper middle incomeUruguayUzbekistanVanuatuVenezuela, RBVietnamWest Bank and GazaWorldYemen, Rep.ZambiaZimbabwe Timeline:
This timeline shows a graph from 1982 to 2016 of Kazakhstan. No data until 1981. Number of actual observations by date: 29.
Source name:
World Development Indicators
Source organization:
UNESCO Institute for Statistics
Categories, topics:
Education
Last updated:
apr 23, 2017
Indicators value changes by year
Minimum:
95.764
jan 1, 2000
Maximum:
123.768
jan 1, 1994
At the date of observation
Value
Absolute change
Change from previous value
jan 1, 1982
111.654
+111.654
0.0%
jan 1, 1987
116.75
+5.096
4.56%
jan 1, 1990
113.521
-3.23
-2.77%
jan 1, 1991
114.501
+0.98
0.86%
jan 1, 1992
118.045
+3.545
3.1%
jan 1, 1993
121.889
+3.844
3.26%
jan 1, 1994
123.768
+1.879
1.54%
jan 1, 1995
122.44
-1.328
-1.07%
jan 1, 1996
101.043
-21.397
-17.48%
jan 1, 1997
101.112
+0.07
0.07%
jan 1, 1998
98.896
-2.216
-2.19%
jan 1, 1999
96.325
-2.571
-2.6%
jan 1, 2000
95.764
-0.561
-0.58%
jan 1, 2001
96.416
+0.653
0.68%
jan 1, 2002
99.351
+2.934
3.04%
jan 1, 2003
100.988
+1.638
1.65%
jan 1, 2004
101.957
+0.969
0.96%
jan 1, 2005
102.667
+0.71
0.7%
jan 1, 2006
101.706
-0.96
-0.94%
jan 1, 2007
100.596
-1.11
-1.09%
jan 1, 2008
101.822
+1.226
1.22%
jan 1, 2009
106.038
+4.215
4.14%
jan 1, 2010
107.213
+1.176
1.11%
jan 1, 2011
107.597
+0.384
0.36%
jan 1, 2012
108.571
+0.974
0.91%
jan 1, 2013
109.169
+0.598
0.55%
jan 1, 2014
110.659
+1.489
1.36%
jan 1, 2015
111.349
+0.69
0.62%
jan 1, 2016
110.564
-0.785
-0.71%
Ranking of countries by current statistics by years


Comments: