29
/
en
AIzaSyAYiBZKx7MnpbEhh9jyipgxe19OcubqV5w
April 1, 2024
93618
Bulgaria
BGR
true
2
1
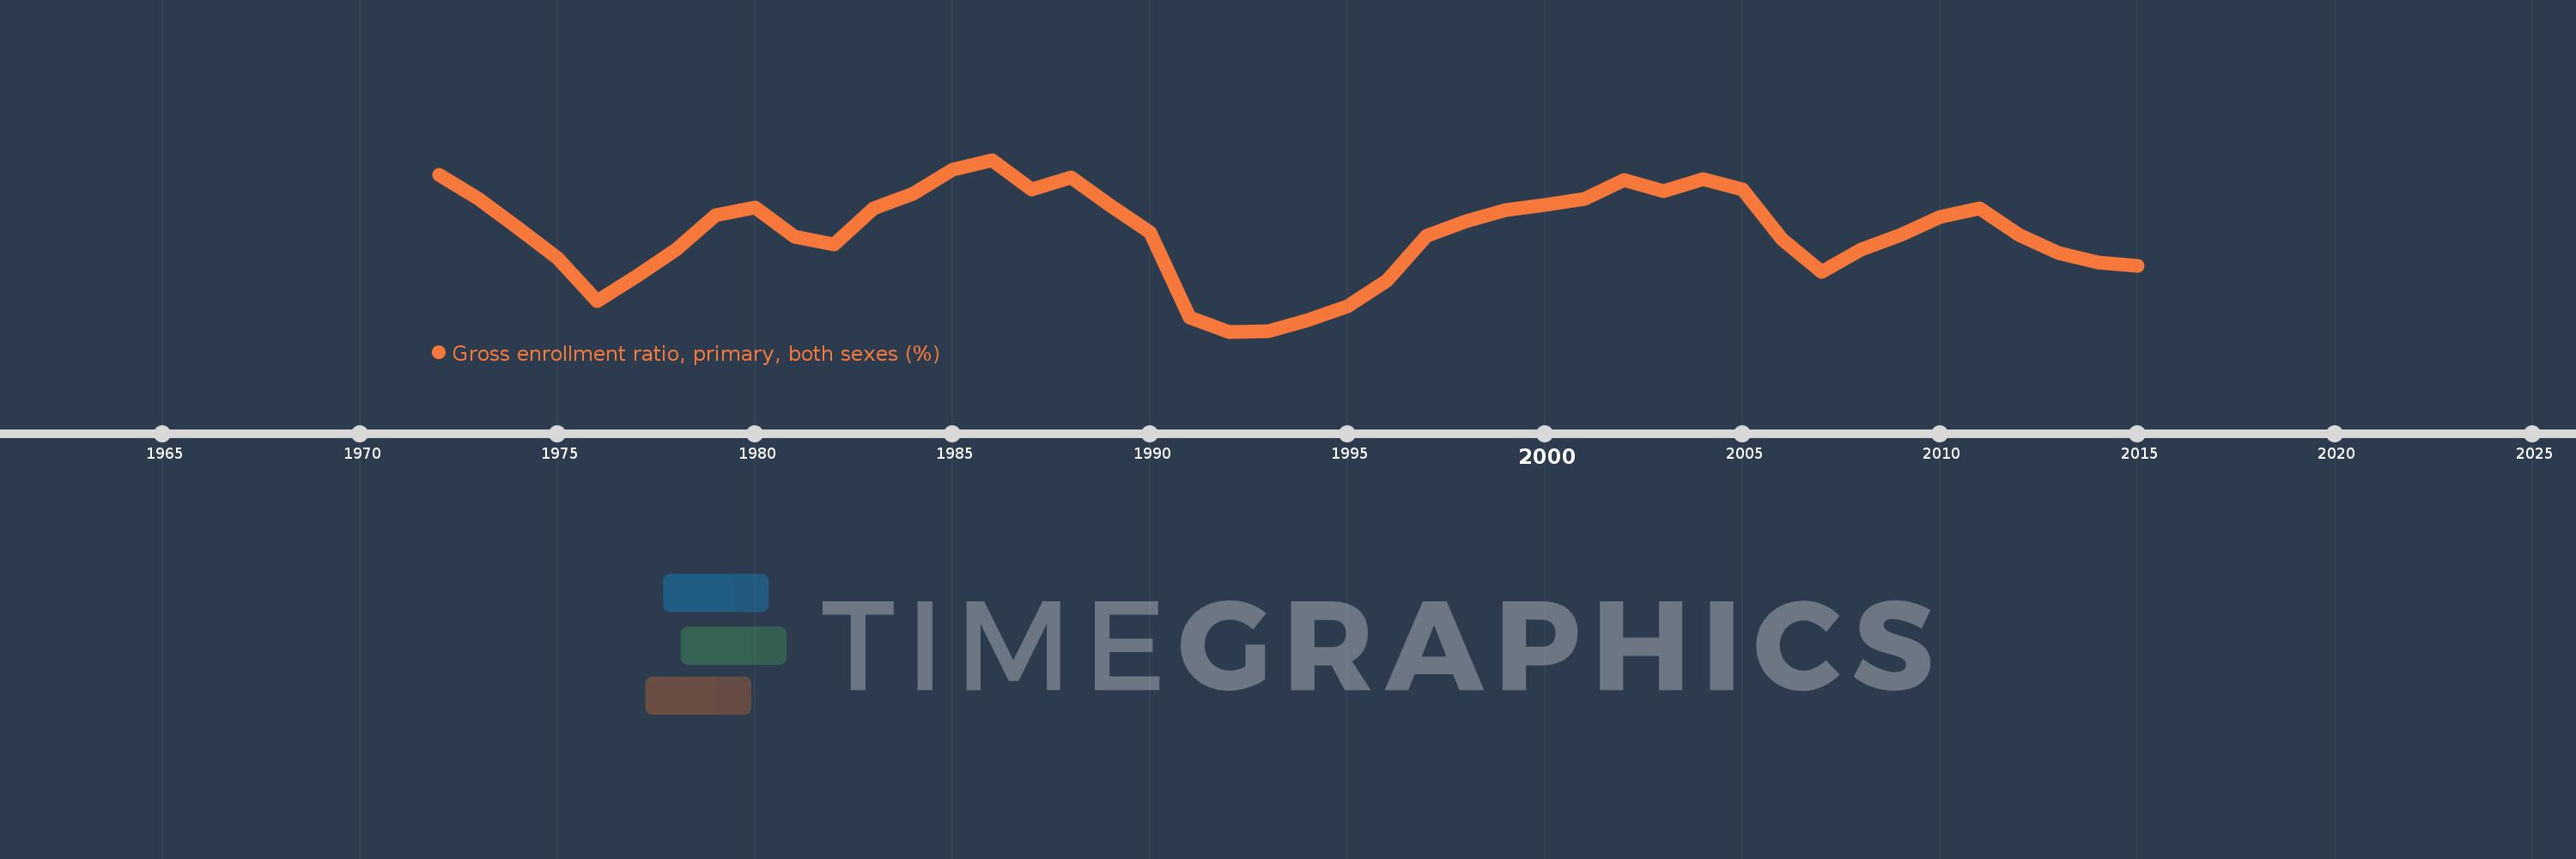
Gross enrollment ratio, primary, both sexes (%)
2015,2014,2013,2012,2011,2010,2009,2008,2007,2006,2005,2004,2003,2002,2001,2000,1999,1998,1997,1996,1995,1994,1993,1992,1991,1990,1989,1988,1987,1986,1985,1984,1983,1982,1981,1980,1979,1978,1977,1976,1975,1974,1973,1972
This statistics in other country:
AfghanistanAlbaniaAlgeriaAndorraAngolaAntigua and BarbudaArab WorldArgentinaArmeniaArubaAustraliaAustriaAzerbaijanBahamas, TheBahrainBangladeshBarbadosBelarusBelgiumBelizeBeninBermudaBhutanBoliviaBosnia and HerzegovinaBotswanaBrazilBritish Virgin IslandsBrunei DarussalamBulgariaBurkina FasoBurundiCabo VerdeCambodiaCameroonCanadaCaribbean small statesCentral African RepublicCentral Europe and the BalticsChadChileChinaColombiaComorosCongo, Dem. Rep.Congo, Rep.Costa RicaCote d'IvoireCroatiaCubaCuracaoCyprusCzech RepublicDenmarkDjiboutiDominicaDominican RepublicEarly-demographic dividendEast Asia & PacificEast Asia & Pacific (excluding high income)East Asia & Pacific (IDA & IBRD countries)EcuadorEgypt, Arab Rep.El SalvadorEquatorial GuineaEritreaEstoniaEthiopiaEuro areaEurope & Central AsiaEurope & Central Asia (excluding high income)Europe & Central Asia (IDA & IBRD countries)European UnionFijiFinlandFragile and conflict affected situationsFranceGabonGambia, TheGeorgiaGermanyGhanaGreeceGrenadaGuatemalaGuineaGuinea-BissauGuyanaHaitiHeavily indebted poor countries (HIPC)High incomeHondurasHong Kong SAR, ChinaHungaryIBRD onlyIcelandIDA & IBRD totalIDA blendIDA onlyIDA totalIndiaIndonesiaIran, Islamic Rep.IraqIrelandIsraelItalyJamaicaJapanJordanKazakhstanKenyaKiribatiKorea, Dem. People’s Rep.Korea, Rep.KuwaitKyrgyz RepublicLao PDRLate-demographic dividendLatin America & Caribbean Latin America & Caribbean (excluding high income)Latin America & the Caribbean (IDA & IBRD countries)LatviaLeast developed countries: UN classificationLebanonLesothoLiberiaLibyaLiechtensteinLithuaniaLow & middle incomeLow incomeLower middle incomeLuxembourgMacao SAR, ChinaMacedonia, FYRMadagascarMalawiMalaysiaMaldivesMaliMaltaMarshall IslandsMauritaniaMauritiusMexicoMicronesia, Fed. Sts.Middle East & North AfricaMiddle East & North Africa (excluding high income)Middle East & North Africa (IDA & IBRD countries)Middle incomeMoldovaMongoliaMontenegroMoroccoMozambiqueMyanmarNamibiaNauruNepalNetherlandsNew ZealandNicaraguaNigerNigeriaNorth AmericaNorwayOECD membersOmanOther small statesPacific island small statesPakistanPalauPanamaPapua New GuineaParaguayPeruPhilippinesPolandPortugalPost-demographic dividendPre-demographic dividendPuerto RicoQatarRomaniaRussian FederationRwandaSamoaSan MarinoSao Tome and PrincipeSaudi ArabiaSenegalSerbiaSeychellesSierra LeoneSlovak RepublicSloveniaSmall statesSolomon IslandsSomaliaSouth AfricaSouth AsiaSouth Asia (IDA & IBRD)South SudanSpainSri LankaSt. Kitts and NevisSt. LuciaSt. Vincent and the GrenadinesSub-Saharan Africa Sub-Saharan Africa (excluding high income)Sub-Saharan Africa (IDA & IBRD countries)SudanSurinameSwazilandSwedenSwitzerlandSyrian Arab RepublicTajikistanTanzaniaThailandTimor-LesteTogoTongaTrinidad and TobagoTunisiaTurkeyTurkmenistanTuvaluUgandaUkraineUnited Arab EmiratesUnited KingdomUnited StatesUpper middle incomeUruguayUzbekistanVanuatuVenezuela, RBVietnamWest Bank and GazaWorldYemen, Rep.ZambiaZimbabwe Timeline:
This timeline shows a graph from 1972 to 2015 of Bulgaria. No data until 1971. Number of actual observations by date: 44.
Source name:
World Development Indicators
Source organization:
UNESCO Institute for Statistics
Categories, topics:
Education
Last updated:
apr 23, 2017
Indicators value changes by year
Minimum:
93.968
jan 1, 1992
Maximum:
107.41
jan 1, 1986
At the date of observation
Value
Absolute change
Change from previous value
jan 1, 1972
106.239
+106.239
0.0%
jan 1, 1973
104.32
-1.919
-1.81%
jan 1, 1974
102.053
-2.267
-2.17%
jan 1, 1975
99.747
-2.306
-2.26%
jan 1, 1976
96.352
-3.394
-3.4%
jan 1, 1977
98.306
+1.953
2.03%
jan 1, 1978
100.42
+2.114
2.15%
jan 1, 1979
103.107
+2.687
2.68%
jan 1, 1980
103.651
+0.544
0.53%
jan 1, 1981
101.418
-2.233
-2.15%
jan 1, 1982
100.817
-0.601
-0.59%
jan 1, 1983
103.6
+2.782
2.76%
jan 1, 1984
104.777
+1.178
1.14%
jan 1, 1985
106.661
+1.884
1.8%
jan 1, 1986
107.41
+0.749
0.7%
jan 1, 1987
105.058
-2.352
-2.19%
jan 1, 1988
106.002
+0.943
0.9%
jan 1, 1989
103.842
-2.16
-2.04%
jan 1, 1990
101.7
-2.142
-2.06%
jan 1, 1991
95.058
-6.642
-6.53%
jan 1, 1992
93.968
-1.09
-1.15%
jan 1, 1993
93.989
+0.02
0.02%
jan 1, 1994
94.883
+0.894
0.95%
jan 1, 1995
95.973
+1.091
1.15%
jan 1, 1996
97.976
+2.003
2.09%
jan 1, 1997
101.458
+3.481
3.55%
jan 1, 1998
102.578
+1.12
1.1%
jan 1, 1999
103.499
+0.921
0.9%
jan 1, 2000
103.858
+0.359
0.35%
jan 1, 2001
104.322
+0.463
0.45%
jan 1, 2002
105.799
+1.477
1.42%
jan 1, 2003
104.986
-0.813
-0.77%
jan 1, 2004
105.891
+0.904
0.86%
jan 1, 2005
105.115
-0.776
-0.73%
jan 1, 2006
101.197
-3.918
-3.73%
jan 1, 2007
98.643
-2.554
-2.52%
jan 1, 2008
100.375
+1.732
1.76%
jan 1, 2009
101.536
+1.161
1.16%
jan 1, 2010
102.926
+1.39
1.37%
jan 1, 2011
103.633
+0.707
0.69%
jan 1, 2012
101.501
-2.133
-2.06%
jan 1, 2013
100.129
-1.372
-1.35%
jan 1, 2014
99.374
-0.755
-0.75%
jan 1, 2015
99.079
-0.295
-0.3%
Ranking of countries by current statistics by years


Comments: