29
/
en
AIzaSyAYiBZKx7MnpbEhh9jyipgxe19OcubqV5w
April 1, 2024
99971
Cameroon
CMR
true
2
1
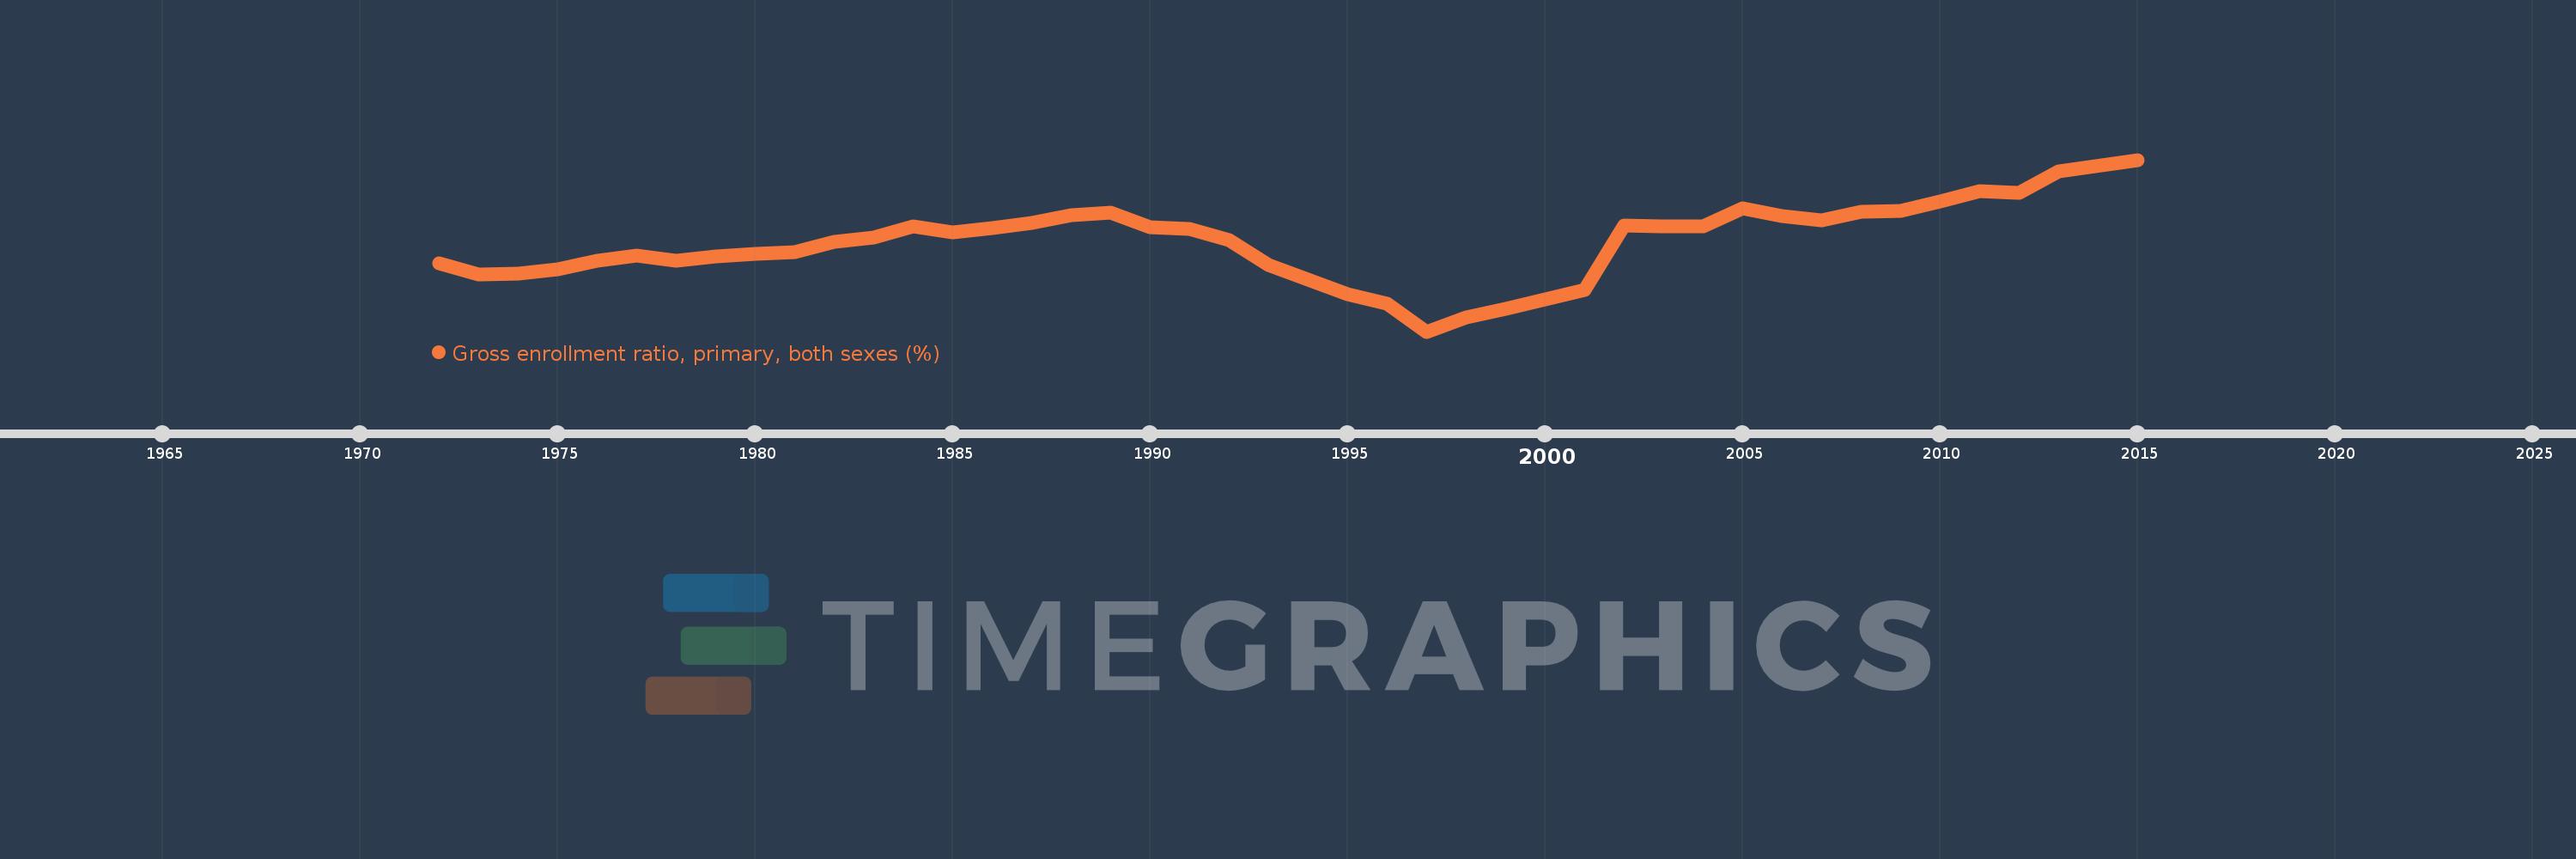
Gross enrollment ratio, primary, both sexes (%)
2015,2013,2012,2011,2010,2009,2008,2007,2006,2005,2004,2003,2002,2001,2000,1999,1998,1997,1996,1995,1993,1992,1991,1990,1989,1988,1987,1986,1985,1984,1983,1982,1981,1980,1979,1978,1977,1976,1975,1974,1973,1972
This statistics in other country:
AfghanistanAlbaniaAlgeriaAndorraAngolaAntigua and BarbudaArab WorldArgentinaArmeniaArubaAustraliaAustriaAzerbaijanBahamas, TheBahrainBangladeshBarbadosBelarusBelgiumBelizeBeninBermudaBhutanBoliviaBosnia and HerzegovinaBotswanaBrazilBritish Virgin IslandsBrunei DarussalamBulgariaBurkina FasoBurundiCabo VerdeCambodiaCameroonCanadaCaribbean small statesCentral African RepublicCentral Europe and the BalticsChadChileChinaColombiaComorosCongo, Dem. Rep.Congo, Rep.Costa RicaCote d'IvoireCroatiaCubaCuracaoCyprusCzech RepublicDenmarkDjiboutiDominicaDominican RepublicEarly-demographic dividendEast Asia & PacificEast Asia & Pacific (excluding high income)East Asia & Pacific (IDA & IBRD countries)EcuadorEgypt, Arab Rep.El SalvadorEquatorial GuineaEritreaEstoniaEthiopiaEuro areaEurope & Central AsiaEurope & Central Asia (excluding high income)Europe & Central Asia (IDA & IBRD countries)European UnionFijiFinlandFragile and conflict affected situationsFranceGabonGambia, TheGeorgiaGermanyGhanaGreeceGrenadaGuatemalaGuineaGuinea-BissauGuyanaHaitiHeavily indebted poor countries (HIPC)High incomeHondurasHong Kong SAR, ChinaHungaryIBRD onlyIcelandIDA & IBRD totalIDA blendIDA onlyIDA totalIndiaIndonesiaIran, Islamic Rep.IraqIrelandIsraelItalyJamaicaJapanJordanKazakhstanKenyaKiribatiKorea, Dem. People’s Rep.Korea, Rep.KuwaitKyrgyz RepublicLao PDRLate-demographic dividendLatin America & Caribbean Latin America & Caribbean (excluding high income)Latin America & the Caribbean (IDA & IBRD countries)LatviaLeast developed countries: UN classificationLebanonLesothoLiberiaLibyaLiechtensteinLithuaniaLow & middle incomeLow incomeLower middle incomeLuxembourgMacao SAR, ChinaMacedonia, FYRMadagascarMalawiMalaysiaMaldivesMaliMaltaMarshall IslandsMauritaniaMauritiusMexicoMicronesia, Fed. Sts.Middle East & North AfricaMiddle East & North Africa (excluding high income)Middle East & North Africa (IDA & IBRD countries)Middle incomeMoldovaMongoliaMontenegroMoroccoMozambiqueMyanmarNamibiaNauruNepalNetherlandsNew ZealandNicaraguaNigerNigeriaNorth AmericaNorwayOECD membersOmanOther small statesPacific island small statesPakistanPalauPanamaPapua New GuineaParaguayPeruPhilippinesPolandPortugalPost-demographic dividendPre-demographic dividendPuerto RicoQatarRomaniaRussian FederationRwandaSamoaSan MarinoSao Tome and PrincipeSaudi ArabiaSenegalSerbiaSeychellesSierra LeoneSlovak RepublicSloveniaSmall statesSolomon IslandsSomaliaSouth AfricaSouth AsiaSouth Asia (IDA & IBRD)South SudanSpainSri LankaSt. Kitts and NevisSt. LuciaSt. Vincent and the GrenadinesSub-Saharan Africa Sub-Saharan Africa (excluding high income)Sub-Saharan Africa (IDA & IBRD countries)SudanSurinameSwazilandSwedenSwitzerlandSyrian Arab RepublicTajikistanTanzaniaThailandTimor-LesteTogoTongaTrinidad and TobagoTunisiaTurkeyTurkmenistanTuvaluUgandaUkraineUnited Arab EmiratesUnited KingdomUnited StatesUpper middle incomeUruguayUzbekistanVanuatuVenezuela, RBVietnamWest Bank and GazaWorldYemen, Rep.ZambiaZimbabwe Timeline:
This timeline shows a graph from 1972 to 2015 of Cameroon. No data until 1971. Number of actual observations by date: 42.
Source name:
World Development Indicators
Source organization:
UNESCO Institute for Statistics
Categories, topics:
Education
Last updated:
apr 23, 2017
Indicators value changes by year
Minimum:
73.382
jan 1, 1997
Maximum:
113.55
jan 1, 2015
At the date of observation
Value
Absolute change
Change from previous value
jan 1, 1972
89.383
+89.383
0.0%
jan 1, 1973
86.78
-2.603
-2.91%
jan 1, 1974
86.955
+0.175
0.2%
jan 1, 1975
87.886
+0.931
1.07%
jan 1, 1976
89.973
+2.087
2.37%
jan 1, 1977
91.235
+1.262
1.4%
jan 1, 1978
89.879
-1.357
-1.49%
jan 1, 1979
90.931
+1.052
1.17%
jan 1, 1980
91.484
+0.553
0.61%
jan 1, 1981
91.921
+0.437
0.48%
jan 1, 1982
94.373
+2.452
2.67%
jan 1, 1983
95.408
+1.035
1.1%
jan 1, 1984
98.022
+2.614
2.74%
jan 1, 1985
96.518
-1.504
-1.53%
jan 1, 1986
97.675
+1.158
1.2%
jan 1, 1987
98.845
+1.17
1.2%
jan 1, 1988
100.52
+1.675
1.69%
jan 1, 1989
101.172
+0.652
0.65%
jan 1, 1990
97.722
-3.45
-3.41%
jan 1, 1991
97.312
-0.41
-0.42%
jan 1, 1992
94.758
-2.554
-2.62%
jan 1, 1993
89.0
-5.759
-6.08%
jan 1, 1995
82.14
-6.859
-7.71%
jan 1, 1996
79.93
-2.21
-2.69%
jan 1, 1997
73.382
-6.548
-8.19%
jan 1, 1998
76.744
+3.362
4.58%
jan 1, 1999
78.727
+1.982
2.58%
jan 1, 2000
81.009
+2.283
2.9%
jan 1, 2001
83.143
+2.133
2.63%
jan 1, 2002
98.143
+15.001
18.04%
jan 1, 2003
97.957
-0.186
-0.19%
jan 1, 2004
97.948
-0.009
-0.01%
jan 1, 2005
102.241
+4.292
4.38%
jan 1, 2006
100.34
-1.9
-1.86%
jan 1, 2007
99.314
-1.027
-1.02%
jan 1, 2008
101.308
+1.994
2.01%
jan 1, 2009
101.645
+0.337
0.33%
jan 1, 2010
103.872
+2.227
2.19%
jan 1, 2011
106.193
+2.321
2.23%
jan 1, 2012
105.906
-0.287
-0.27%
jan 1, 2013
110.811
+4.905
4.63%
jan 1, 2015
113.55
+2.739
2.47%
Ranking of countries by current statistics by years


Comments: