29
/
en
AIzaSyAYiBZKx7MnpbEhh9jyipgxe19OcubqV5w
April 1, 2024
119920
Djibouti
DJI
true
2
1
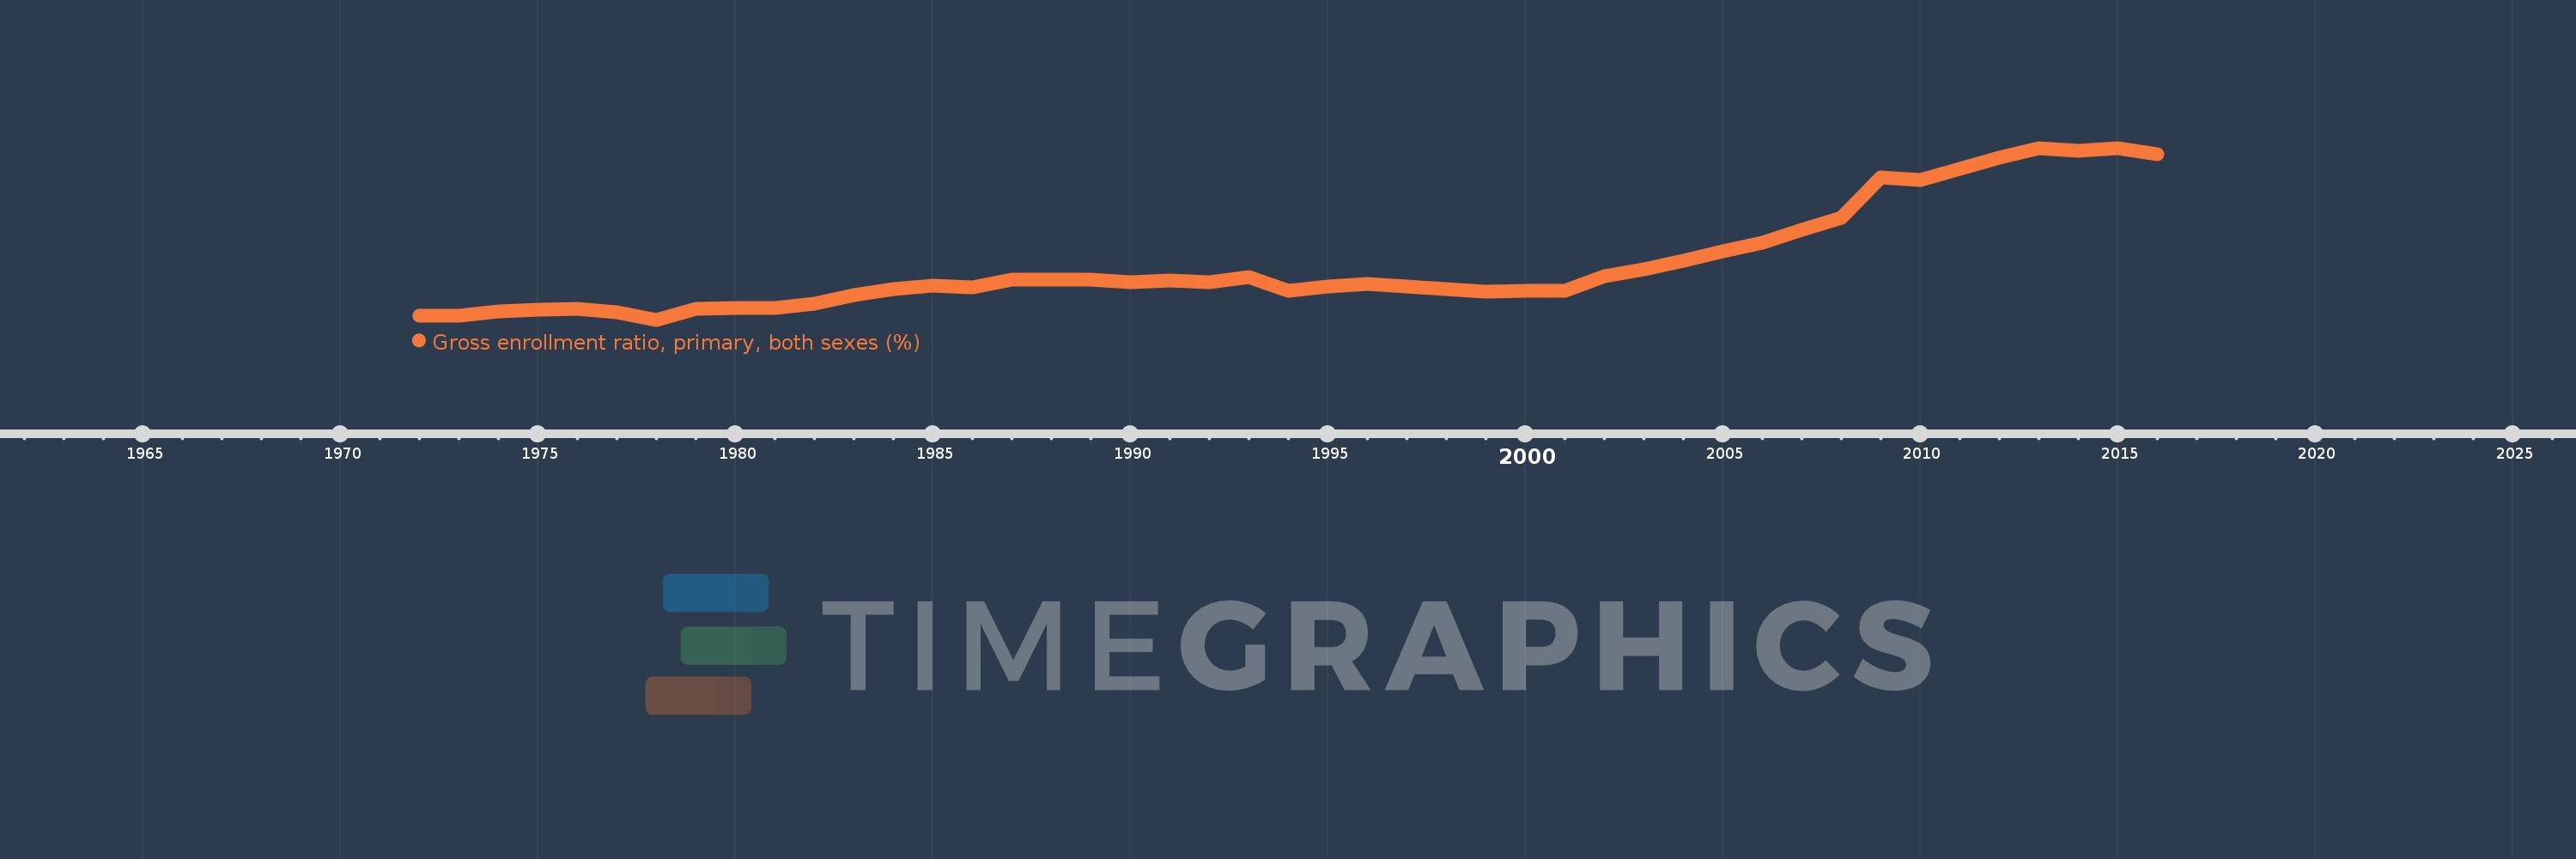
Gross enrollment ratio, primary, both sexes (%)
2016,2015,2014,2013,2012,2010,2009,2008,2007,2006,2005,2004,2003,2002,2001,2000,1999,1998,1997,1996,1995,1994,1993,1992,1991,1990,1989,1988,1987,1986,1985,1984,1983,1982,1981,1980,1979,1978,1977,1976,1975,1974,1973,1972
This statistics in other country:
AfghanistanAlbaniaAlgeriaAndorraAngolaAntigua and BarbudaArab WorldArgentinaArmeniaArubaAustraliaAustriaAzerbaijanBahamas, TheBahrainBangladeshBarbadosBelarusBelgiumBelizeBeninBermudaBhutanBoliviaBosnia and HerzegovinaBotswanaBrazilBritish Virgin IslandsBrunei DarussalamBulgariaBurkina FasoBurundiCabo VerdeCambodiaCameroonCanadaCaribbean small statesCentral African RepublicCentral Europe and the BalticsChadChileChinaColombiaComorosCongo, Dem. Rep.Congo, Rep.Costa RicaCote d'IvoireCroatiaCubaCuracaoCyprusCzech RepublicDenmarkDjiboutiDominicaDominican RepublicEarly-demographic dividendEast Asia & PacificEast Asia & Pacific (excluding high income)East Asia & Pacific (IDA & IBRD countries)EcuadorEgypt, Arab Rep.El SalvadorEquatorial GuineaEritreaEstoniaEthiopiaEuro areaEurope & Central AsiaEurope & Central Asia (excluding high income)Europe & Central Asia (IDA & IBRD countries)European UnionFijiFinlandFragile and conflict affected situationsFranceGabonGambia, TheGeorgiaGermanyGhanaGreeceGrenadaGuatemalaGuineaGuinea-BissauGuyanaHaitiHeavily indebted poor countries (HIPC)High incomeHondurasHong Kong SAR, ChinaHungaryIBRD onlyIcelandIDA & IBRD totalIDA blendIDA onlyIDA totalIndiaIndonesiaIran, Islamic Rep.IraqIrelandIsraelItalyJamaicaJapanJordanKazakhstanKenyaKiribatiKorea, Dem. People’s Rep.Korea, Rep.KuwaitKyrgyz RepublicLao PDRLate-demographic dividendLatin America & Caribbean Latin America & Caribbean (excluding high income)Latin America & the Caribbean (IDA & IBRD countries)LatviaLeast developed countries: UN classificationLebanonLesothoLiberiaLibyaLiechtensteinLithuaniaLow & middle incomeLow incomeLower middle incomeLuxembourgMacao SAR, ChinaMacedonia, FYRMadagascarMalawiMalaysiaMaldivesMaliMaltaMarshall IslandsMauritaniaMauritiusMexicoMicronesia, Fed. Sts.Middle East & North AfricaMiddle East & North Africa (excluding high income)Middle East & North Africa (IDA & IBRD countries)Middle incomeMoldovaMongoliaMontenegroMoroccoMozambiqueMyanmarNamibiaNauruNepalNetherlandsNew ZealandNicaraguaNigerNigeriaNorth AmericaNorwayOECD membersOmanOther small statesPacific island small statesPakistanPalauPanamaPapua New GuineaParaguayPeruPhilippinesPolandPortugalPost-demographic dividendPre-demographic dividendPuerto RicoQatarRomaniaRussian FederationRwandaSamoaSan MarinoSao Tome and PrincipeSaudi ArabiaSenegalSerbiaSeychellesSierra LeoneSlovak RepublicSloveniaSmall statesSolomon IslandsSomaliaSouth AfricaSouth AsiaSouth Asia (IDA & IBRD)South SudanSpainSri LankaSt. Kitts and NevisSt. LuciaSt. Vincent and the GrenadinesSub-Saharan Africa Sub-Saharan Africa (excluding high income)Sub-Saharan Africa (IDA & IBRD countries)SudanSurinameSwazilandSwedenSwitzerlandSyrian Arab RepublicTajikistanTanzaniaThailandTimor-LesteTogoTongaTrinidad and TobagoTunisiaTurkeyTurkmenistanTuvaluUgandaUkraineUnited Arab EmiratesUnited KingdomUnited StatesUpper middle incomeUruguayUzbekistanVanuatuVenezuela, RBVietnamWest Bank and GazaWorldYemen, Rep.ZambiaZimbabwe Timeline:
This timeline shows a graph from 1972 to 2016 of Djibouti. No data until 1971. Number of actual observations by date: 44.
Source name:
World Development Indicators
Source organization:
UNESCO Institute for Statistics
Categories, topics:
Education
Last updated:
apr 23, 2017
Indicators value changes by year
Maximum:
67.955
jan 1, 2015
At the date of observation
Value
Absolute change
Change from previous value
jan 1, 1972
24.621
+24.621
0.0%
jan 1, 1973
24.761
+0.14
0.57%
jan 1, 1974
25.75
+0.989
4.0%
jan 1, 1975
26.25
+0.5
1.94%
jan 1, 1976
26.494
+0.244
0.93%
jan 1, 1977
25.498
-0.996
-3.76%
jan 1, 1978
23.68
-1.818
-7.13%
jan 1, 1979
26.553
+2.873
12.13%
jan 1, 1980
26.631
+0.077
0.29%
jan 1, 1981
26.615
-0.016
-0.06%
jan 1, 1982
27.851
+1.236
4.64%
jan 1, 1983
30.105
+2.254
8.09%
jan 1, 1984
31.501
+1.396
4.64%
jan 1, 1985
32.499
+0.998
3.17%
jan 1, 1986
32.037
-0.462
-1.42%
jan 1, 1987
33.955
+1.917
5.99%
jan 1, 1988
34.014
+0.06
0.18%
jan 1, 1989
33.915
-0.099
-0.29%
jan 1, 1990
33.334
-0.581
-1.71%
jan 1, 1991
33.861
+0.527
1.58%
jan 1, 1992
33.449
-0.411
-1.21%
jan 1, 1993
34.572
+1.123
3.36%
jan 1, 1994
31.046
-3.526
-10.2%
jan 1, 1995
32.348
+1.303
4.2%
jan 1, 1996
32.819
+0.471
1.46%
jan 1, 1997
32.347
-0.473
-1.44%
jan 1, 1998
31.529
-0.818
-2.53%
jan 1, 1999
30.866
-0.663
-2.1%
jan 1, 2000
31.18
+0.314
1.02%
jan 1, 2001
31.124
-0.056
-0.18%
jan 1, 2002
34.884
+3.76
12.08%
jan 1, 2003
36.757
+1.873
5.37%
jan 1, 2004
38.807
+2.05
5.58%
jan 1, 2005
41.23
+2.423
6.24%
jan 1, 2006
43.441
+2.211
5.36%
jan 1, 2007
46.782
+3.34
7.69%
jan 1, 2008
50.005
+3.223
6.89%
jan 1, 2009
60.423
+10.419
20.84%
jan 1, 2010
59.735
-0.688
-1.14%
jan 1, 2012
65.512
+5.776
9.67%
jan 1, 2013
67.933
+2.422
3.7%
jan 1, 2014
67.278
-0.655
-0.96%
jan 1, 2015
67.955
+0.676
1.01%
jan 1, 2016
66.263
-1.691
-2.49%
Ranking of countries by current statistics by years


Comments: