29
/
en
AIzaSyAYiBZKx7MnpbEhh9jyipgxe19OcubqV5w
April 1, 2024
256388
Sweden
SWE
true
2
1
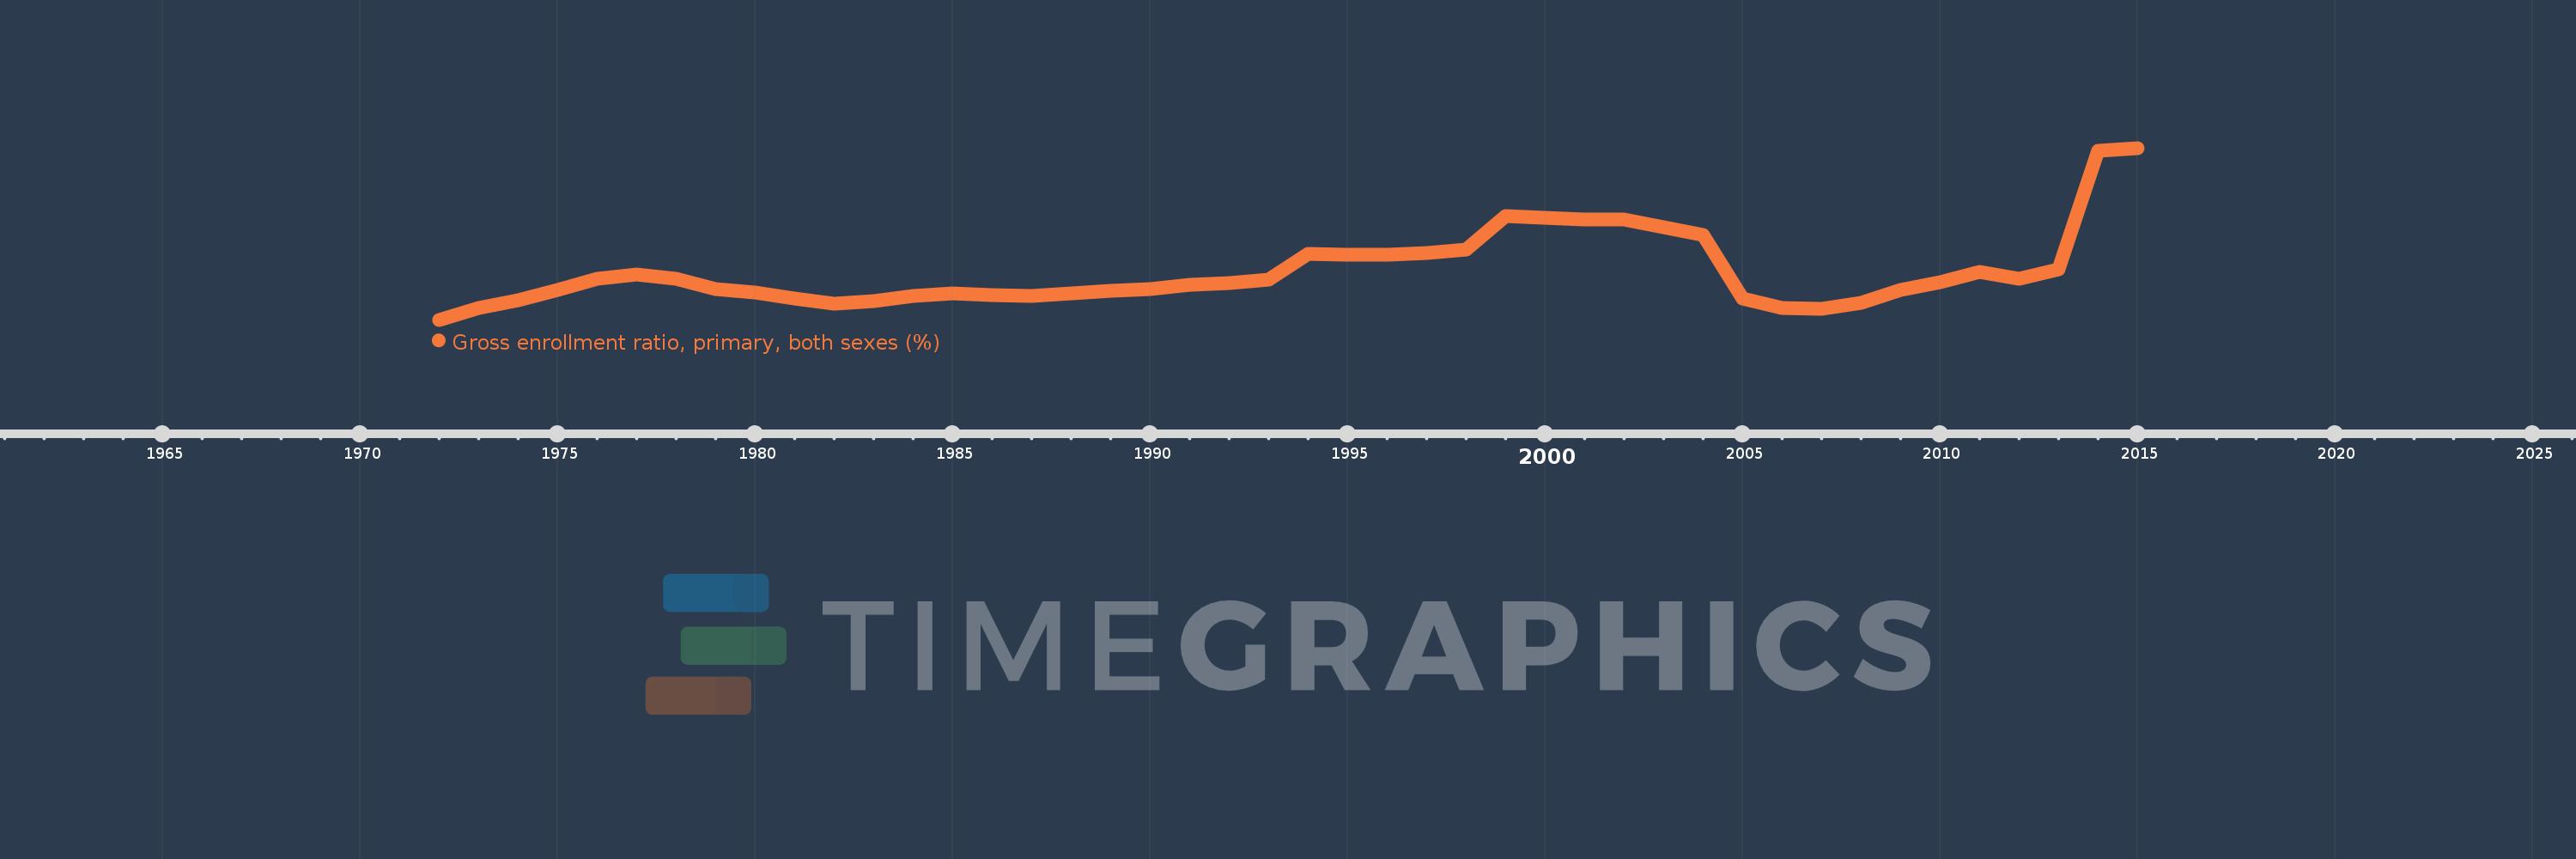
Gross enrollment ratio, primary, both sexes (%)
2015,2014,2013,2012,2011,2010,2009,2008,2007,2006,2005,2004,2003,2002,2001,2000,1999,1998,1997,1996,1995,1994,1993,1992,1991,1990,1989,1988,1987,1986,1985,1984,1983,1982,1981,1980,1979,1978,1977,1976,1975,1974,1973,1972
This statistics in other country:
AfghanistanAlbaniaAlgeriaAndorraAngolaAntigua and BarbudaArab WorldArgentinaArmeniaArubaAustraliaAustriaAzerbaijanBahamas, TheBahrainBangladeshBarbadosBelarusBelgiumBelizeBeninBermudaBhutanBoliviaBosnia and HerzegovinaBotswanaBrazilBritish Virgin IslandsBrunei DarussalamBulgariaBurkina FasoBurundiCabo VerdeCambodiaCameroonCanadaCaribbean small statesCentral African RepublicCentral Europe and the BalticsChadChileChinaColombiaComorosCongo, Dem. Rep.Congo, Rep.Costa RicaCote d'IvoireCroatiaCubaCuracaoCyprusCzech RepublicDenmarkDjiboutiDominicaDominican RepublicEarly-demographic dividendEast Asia & PacificEast Asia & Pacific (excluding high income)East Asia & Pacific (IDA & IBRD countries)EcuadorEgypt, Arab Rep.El SalvadorEquatorial GuineaEritreaEstoniaEthiopiaEuro areaEurope & Central AsiaEurope & Central Asia (excluding high income)Europe & Central Asia (IDA & IBRD countries)European UnionFijiFinlandFragile and conflict affected situationsFranceGabonGambia, TheGeorgiaGermanyGhanaGreeceGrenadaGuatemalaGuineaGuinea-BissauGuyanaHaitiHeavily indebted poor countries (HIPC)High incomeHondurasHong Kong SAR, ChinaHungaryIBRD onlyIcelandIDA & IBRD totalIDA blendIDA onlyIDA totalIndiaIndonesiaIran, Islamic Rep.IraqIrelandIsraelItalyJamaicaJapanJordanKazakhstanKenyaKiribatiKorea, Dem. People’s Rep.Korea, Rep.KuwaitKyrgyz RepublicLao PDRLate-demographic dividendLatin America & Caribbean Latin America & Caribbean (excluding high income)Latin America & the Caribbean (IDA & IBRD countries)LatviaLeast developed countries: UN classificationLebanonLesothoLiberiaLibyaLiechtensteinLithuaniaLow & middle incomeLow incomeLower middle incomeLuxembourgMacao SAR, ChinaMacedonia, FYRMadagascarMalawiMalaysiaMaldivesMaliMaltaMarshall IslandsMauritaniaMauritiusMexicoMicronesia, Fed. Sts.Middle East & North AfricaMiddle East & North Africa (excluding high income)Middle East & North Africa (IDA & IBRD countries)Middle incomeMoldovaMongoliaMontenegroMoroccoMozambiqueMyanmarNamibiaNauruNepalNetherlandsNew ZealandNicaraguaNigerNigeriaNorth AmericaNorwayOECD membersOmanOther small statesPacific island small statesPakistanPalauPanamaPapua New GuineaParaguayPeruPhilippinesPolandPortugalPost-demographic dividendPre-demographic dividendPuerto RicoQatarRomaniaRussian FederationRwandaSamoaSan MarinoSao Tome and PrincipeSaudi ArabiaSenegalSerbiaSeychellesSierra LeoneSlovak RepublicSloveniaSmall statesSolomon IslandsSomaliaSouth AfricaSouth AsiaSouth Asia (IDA & IBRD)South SudanSpainSri LankaSt. Kitts and NevisSt. LuciaSt. Vincent and the GrenadinesSub-Saharan Africa Sub-Saharan Africa (excluding high income)Sub-Saharan Africa (IDA & IBRD countries)SudanSurinameSwazilandSwedenSwitzerlandSyrian Arab RepublicTajikistanTanzaniaThailandTimor-LesteTogoTongaTrinidad and TobagoTunisiaTurkeyTurkmenistanTuvaluUgandaUkraineUnited Arab EmiratesUnited KingdomUnited StatesUpper middle incomeUruguayUzbekistanVanuatuVenezuela, RBVietnamWest Bank and GazaWorldYemen, Rep.ZambiaZimbabwe Timeline:
This timeline shows a graph from 1972 to 2015 of Sweden. No data until 1971. Number of actual observations by date: 44.
Source name:
World Development Indicators
Source organization:
UNESCO Institute for Statistics
Categories, topics:
Education
Last updated:
apr 23, 2017
Indicators value changes by year
Minimum:
94.056
jan 1, 1972
Maximum:
120.901
jan 1, 2015
At the date of observation
Value
Absolute change
Change from previous value
jan 1, 1972
94.056
+94.056
0.0%
jan 1, 1973
95.849
+1.793
1.91%
jan 1, 1974
97.103
+1.255
1.31%
jan 1, 1975
98.779
+1.676
1.73%
jan 1, 1976
100.402
+1.623
1.64%
jan 1, 1977
101.149
+0.747
0.74%
jan 1, 1978
100.422
-0.727
-0.72%
jan 1, 1979
98.863
-1.56
-1.55%
jan 1, 1980
98.354
-0.509
-0.51%
jan 1, 1981
97.318
-1.036
-1.05%
jan 1, 1982
96.543
-0.775
-0.8%
jan 1, 1983
96.964
+0.421
0.44%
jan 1, 1984
97.816
+0.852
0.88%
jan 1, 1985
98.183
+0.367
0.37%
jan 1, 1986
97.898
-0.285
-0.29%
jan 1, 1987
97.738
-0.159
-0.16%
jan 1, 1988
98.212
+0.474
0.49%
jan 1, 1989
98.543
+0.331
0.34%
jan 1, 1990
98.817
+0.274
0.28%
jan 1, 1991
99.557
+0.74
0.75%
jan 1, 1992
99.764
+0.207
0.21%
jan 1, 1993
100.366
+0.602
0.6%
jan 1, 1994
104.303
+3.937
3.92%
jan 1, 1995
104.204
-0.099
-0.09%
jan 1, 1996
104.281
+0.077
0.07%
jan 1, 1997
104.426
+0.145
0.14%
jan 1, 1998
104.989
+0.563
0.54%
jan 1, 1999
110.192
+5.203
4.96%
jan 1, 2000
109.948
-0.244
-0.22%
jan 1, 2001
109.657
-0.291
-0.26%
jan 1, 2002
109.725
+0.069
0.06%
jan 1, 2003
108.561
-1.165
-1.06%
jan 1, 2004
107.346
-1.214
-1.12%
jan 1, 2005
97.38
-9.967
-9.28%
jan 1, 2006
95.871
-1.509
-1.55%
jan 1, 2007
95.712
-0.158
-0.17%
jan 1, 2008
96.732
+1.019
1.07%
jan 1, 2009
98.758
+2.026
2.09%
jan 1, 2010
99.969
+1.211
1.23%
jan 1, 2011
101.521
+1.552
1.55%
jan 1, 2012
100.502
-1.019
-1.0%
jan 1, 2013
101.975
+1.474
1.47%
jan 1, 2014
120.463
+18.487
18.13%
jan 1, 2015
120.901
+0.438
0.36%
Ranking of countries by current statistics by years


Comments: