29
/
en
AIzaSyAYiBZKx7MnpbEhh9jyipgxe19OcubqV5w
April 1, 2024
258372
Syrian Arab Republic
SYR
true
2
1
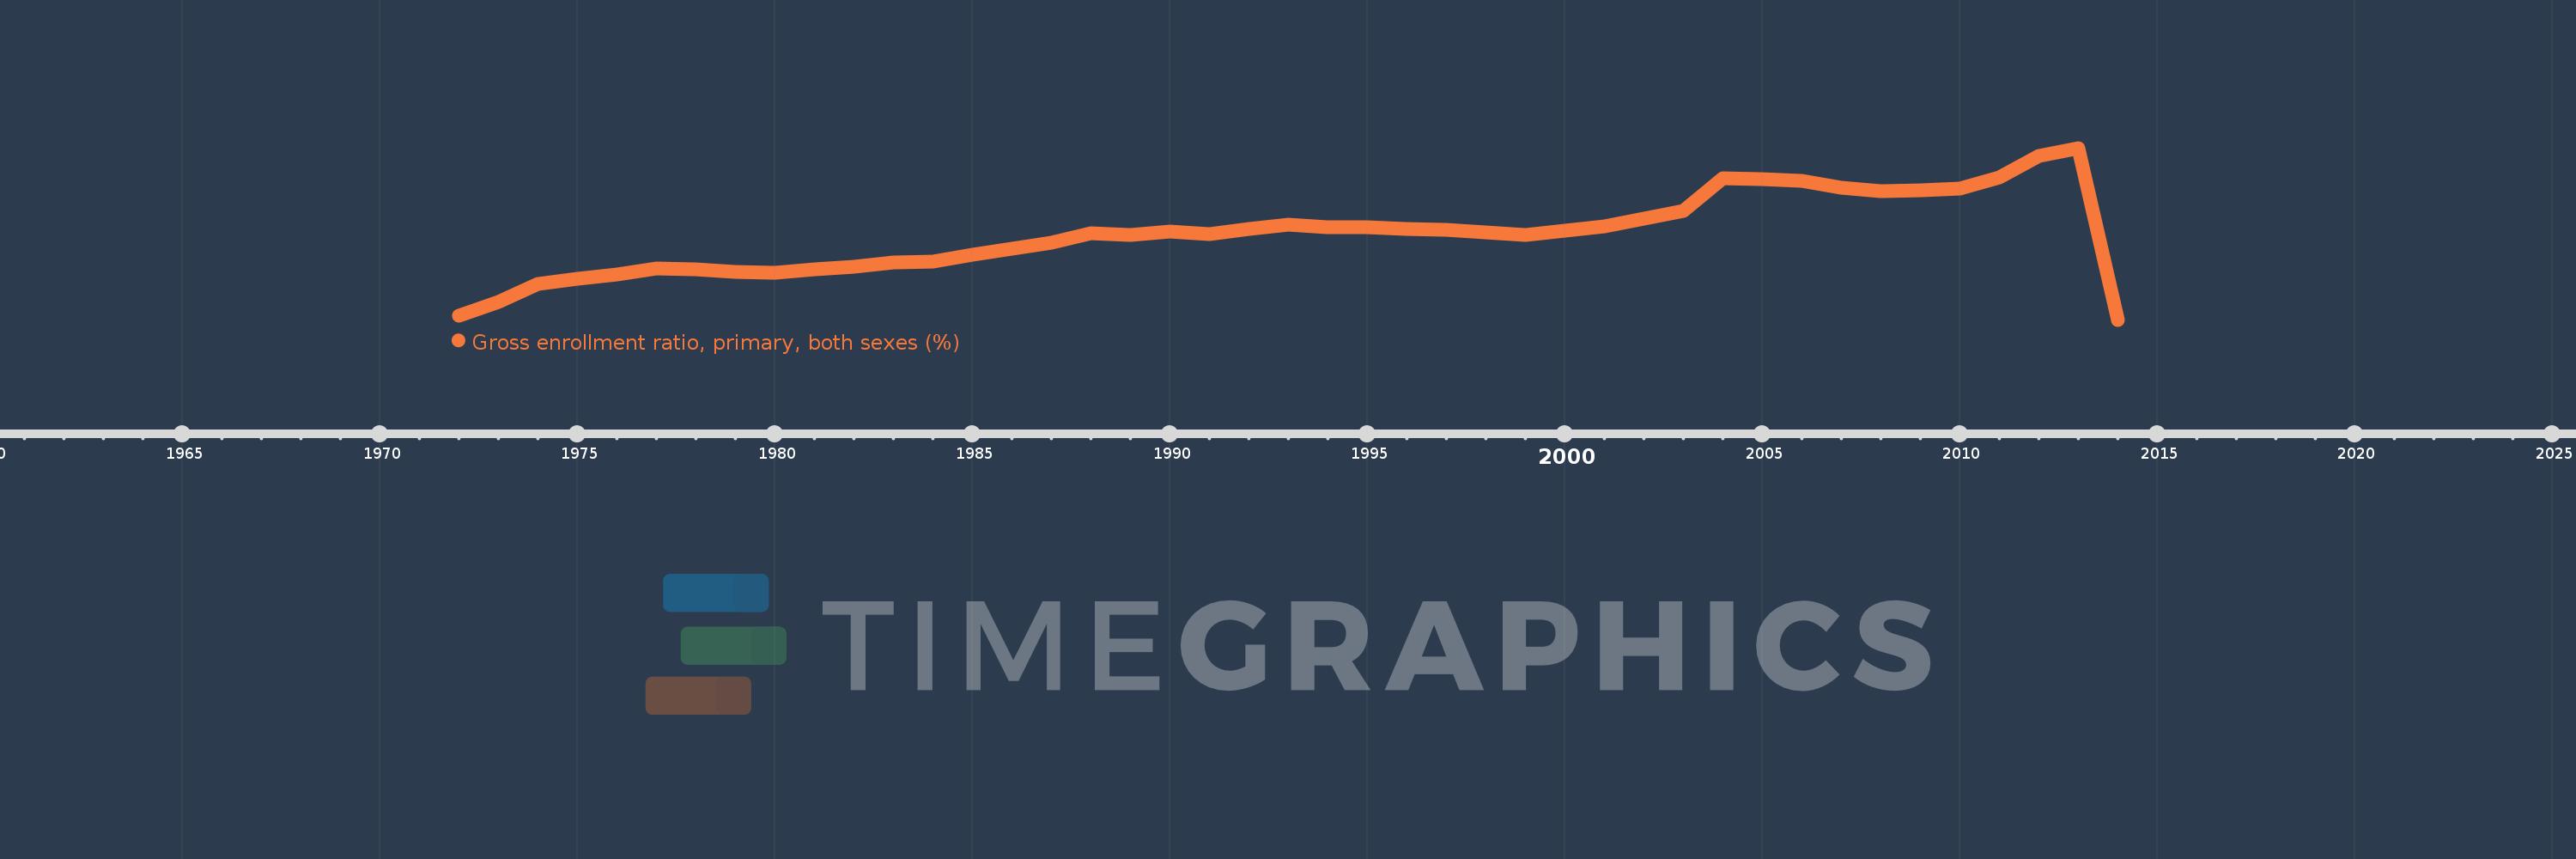
Gross enrollment ratio, primary, both sexes (%)
2014,2013,2012,2011,2010,2009,2008,2007,2006,2005,2004,2003,2002,2001,2000,1999,1998,1997,1996,1995,1994,1993,1992,1991,1990,1989,1988,1987,1986,1985,1984,1983,1982,1981,1980,1979,1978,1977,1976,1975,1974,1973,1972
This statistics in other country:
AfghanistanAlbaniaAlgeriaAndorraAngolaAntigua and BarbudaArab WorldArgentinaArmeniaArubaAustraliaAustriaAzerbaijanBahamas, TheBahrainBangladeshBarbadosBelarusBelgiumBelizeBeninBermudaBhutanBoliviaBosnia and HerzegovinaBotswanaBrazilBritish Virgin IslandsBrunei DarussalamBulgariaBurkina FasoBurundiCabo VerdeCambodiaCameroonCanadaCaribbean small statesCentral African RepublicCentral Europe and the BalticsChadChileChinaColombiaComorosCongo, Dem. Rep.Congo, Rep.Costa RicaCote d'IvoireCroatiaCubaCuracaoCyprusCzech RepublicDenmarkDjiboutiDominicaDominican RepublicEarly-demographic dividendEast Asia & PacificEast Asia & Pacific (excluding high income)East Asia & Pacific (IDA & IBRD countries)EcuadorEgypt, Arab Rep.El SalvadorEquatorial GuineaEritreaEstoniaEthiopiaEuro areaEurope & Central AsiaEurope & Central Asia (excluding high income)Europe & Central Asia (IDA & IBRD countries)European UnionFijiFinlandFragile and conflict affected situationsFranceGabonGambia, TheGeorgiaGermanyGhanaGreeceGrenadaGuatemalaGuineaGuinea-BissauGuyanaHaitiHeavily indebted poor countries (HIPC)High incomeHondurasHong Kong SAR, ChinaHungaryIBRD onlyIcelandIDA & IBRD totalIDA blendIDA onlyIDA totalIndiaIndonesiaIran, Islamic Rep.IraqIrelandIsraelItalyJamaicaJapanJordanKazakhstanKenyaKiribatiKorea, Dem. People’s Rep.Korea, Rep.KuwaitKyrgyz RepublicLao PDRLate-demographic dividendLatin America & Caribbean Latin America & Caribbean (excluding high income)Latin America & the Caribbean (IDA & IBRD countries)LatviaLeast developed countries: UN classificationLebanonLesothoLiberiaLibyaLiechtensteinLithuaniaLow & middle incomeLow incomeLower middle incomeLuxembourgMacao SAR, ChinaMacedonia, FYRMadagascarMalawiMalaysiaMaldivesMaliMaltaMarshall IslandsMauritaniaMauritiusMexicoMicronesia, Fed. Sts.Middle East & North AfricaMiddle East & North Africa (excluding high income)Middle East & North Africa (IDA & IBRD countries)Middle incomeMoldovaMongoliaMontenegroMoroccoMozambiqueMyanmarNamibiaNauruNepalNetherlandsNew ZealandNicaraguaNigerNigeriaNorth AmericaNorwayOECD membersOmanOther small statesPacific island small statesPakistanPalauPanamaPapua New GuineaParaguayPeruPhilippinesPolandPortugalPost-demographic dividendPre-demographic dividendPuerto RicoQatarRomaniaRussian FederationRwandaSamoaSan MarinoSao Tome and PrincipeSaudi ArabiaSenegalSerbiaSeychellesSierra LeoneSlovak RepublicSloveniaSmall statesSolomon IslandsSomaliaSouth AfricaSouth AsiaSouth Asia (IDA & IBRD)South SudanSpainSri LankaSt. Kitts and NevisSt. LuciaSt. Vincent and the GrenadinesSub-Saharan Africa Sub-Saharan Africa (excluding high income)Sub-Saharan Africa (IDA & IBRD countries)SudanSurinameSwazilandSwedenSwitzerlandSyrian Arab RepublicTajikistanTanzaniaThailandTimor-LesteTogoTongaTrinidad and TobagoTunisiaTurkeyTurkmenistanTuvaluUgandaUkraineUnited Arab EmiratesUnited KingdomUnited StatesUpper middle incomeUruguayUzbekistanVanuatuVenezuela, RBVietnamWest Bank and GazaWorldYemen, Rep.ZambiaZimbabwe Timeline:
This timeline shows a graph from 1972 to 2014 of Syrian Arab Republic. No data until 1971. Number of actual observations by date: 43.
Source name:
World Development Indicators
Source organization:
UNESCO Institute for Statistics
Categories, topics:
Education
Last updated:
apr 23, 2017
Indicators value changes by year
Minimum:
80.101
jan 1, 2014
Maximum:
130.921
jan 1, 2013
At the date of observation
Value
Absolute change
Change from previous value
jan 1, 1972
81.297
+81.297
0.0%
jan 1, 1973
85.463
+4.167
5.13%
jan 1, 1974
90.648
+5.185
6.07%
jan 1, 1975
92.331
+1.683
1.86%
jan 1, 1976
93.416
+1.085
1.18%
jan 1, 1977
95.2
+1.784
1.91%
jan 1, 1978
95.029
-0.171
-0.18%
jan 1, 1979
94.363
-0.666
-0.7%
jan 1, 1980
94.101
-0.262
-0.28%
jan 1, 1981
95.052
+0.952
1.01%
jan 1, 1982
95.724
+0.671
0.71%
jan 1, 1983
97.046
+1.322
1.38%
jan 1, 1984
97.394
+0.348
0.36%
jan 1, 1985
99.457
+2.063
2.12%
jan 1, 1986
101.063
+1.605
1.61%
jan 1, 1987
102.912
+1.849
1.83%
jan 1, 1988
105.759
+2.847
2.77%
jan 1, 1989
105.214
-0.545
-0.52%
jan 1, 1990
106.071
+0.857
0.81%
jan 1, 1991
105.538
-0.534
-0.5%
jan 1, 1992
106.969
+1.431
1.36%
jan 1, 1993
108.25
+1.281
1.2%
jan 1, 1994
107.44
-0.809
-0.75%
jan 1, 1995
107.594
+0.154
0.14%
jan 1, 1996
107.04
-0.554
-0.51%
jan 1, 1997
106.623
-0.417
-0.39%
jan 1, 1998
105.975
-0.648
-0.61%
jan 1, 1999
105.274
-0.701
-0.66%
jan 1, 2000
106.427
+1.152
1.09%
jan 1, 2001
107.676
+1.249
1.17%
jan 1, 2002
109.978
+2.302
2.14%
jan 1, 2003
112.193
+2.215
2.01%
jan 1, 2004
122.026
+9.833
8.76%
jan 1, 2005
121.614
-0.412
-0.34%
jan 1, 2006
121.302
-0.312
-0.26%
jan 1, 2007
119.22
-2.082
-1.72%
jan 1, 2008
118.215
-1.005
-0.84%
jan 1, 2009
118.491
+0.275
0.23%
jan 1, 2010
119.025
+0.534
0.45%
jan 1, 2011
122.235
+3.211
2.7%
jan 1, 2012
128.676
+6.441
5.27%
jan 1, 2013
130.921
+2.245
1.74%
jan 1, 2014
80.101
-50.82
-38.82%
Ranking of countries by current statistics by years


Comments: