29
/
en
AIzaSyAYiBZKx7MnpbEhh9jyipgxe19OcubqV5w
April 1, 2024
61646
Upper middle income
UMC
false
2
1
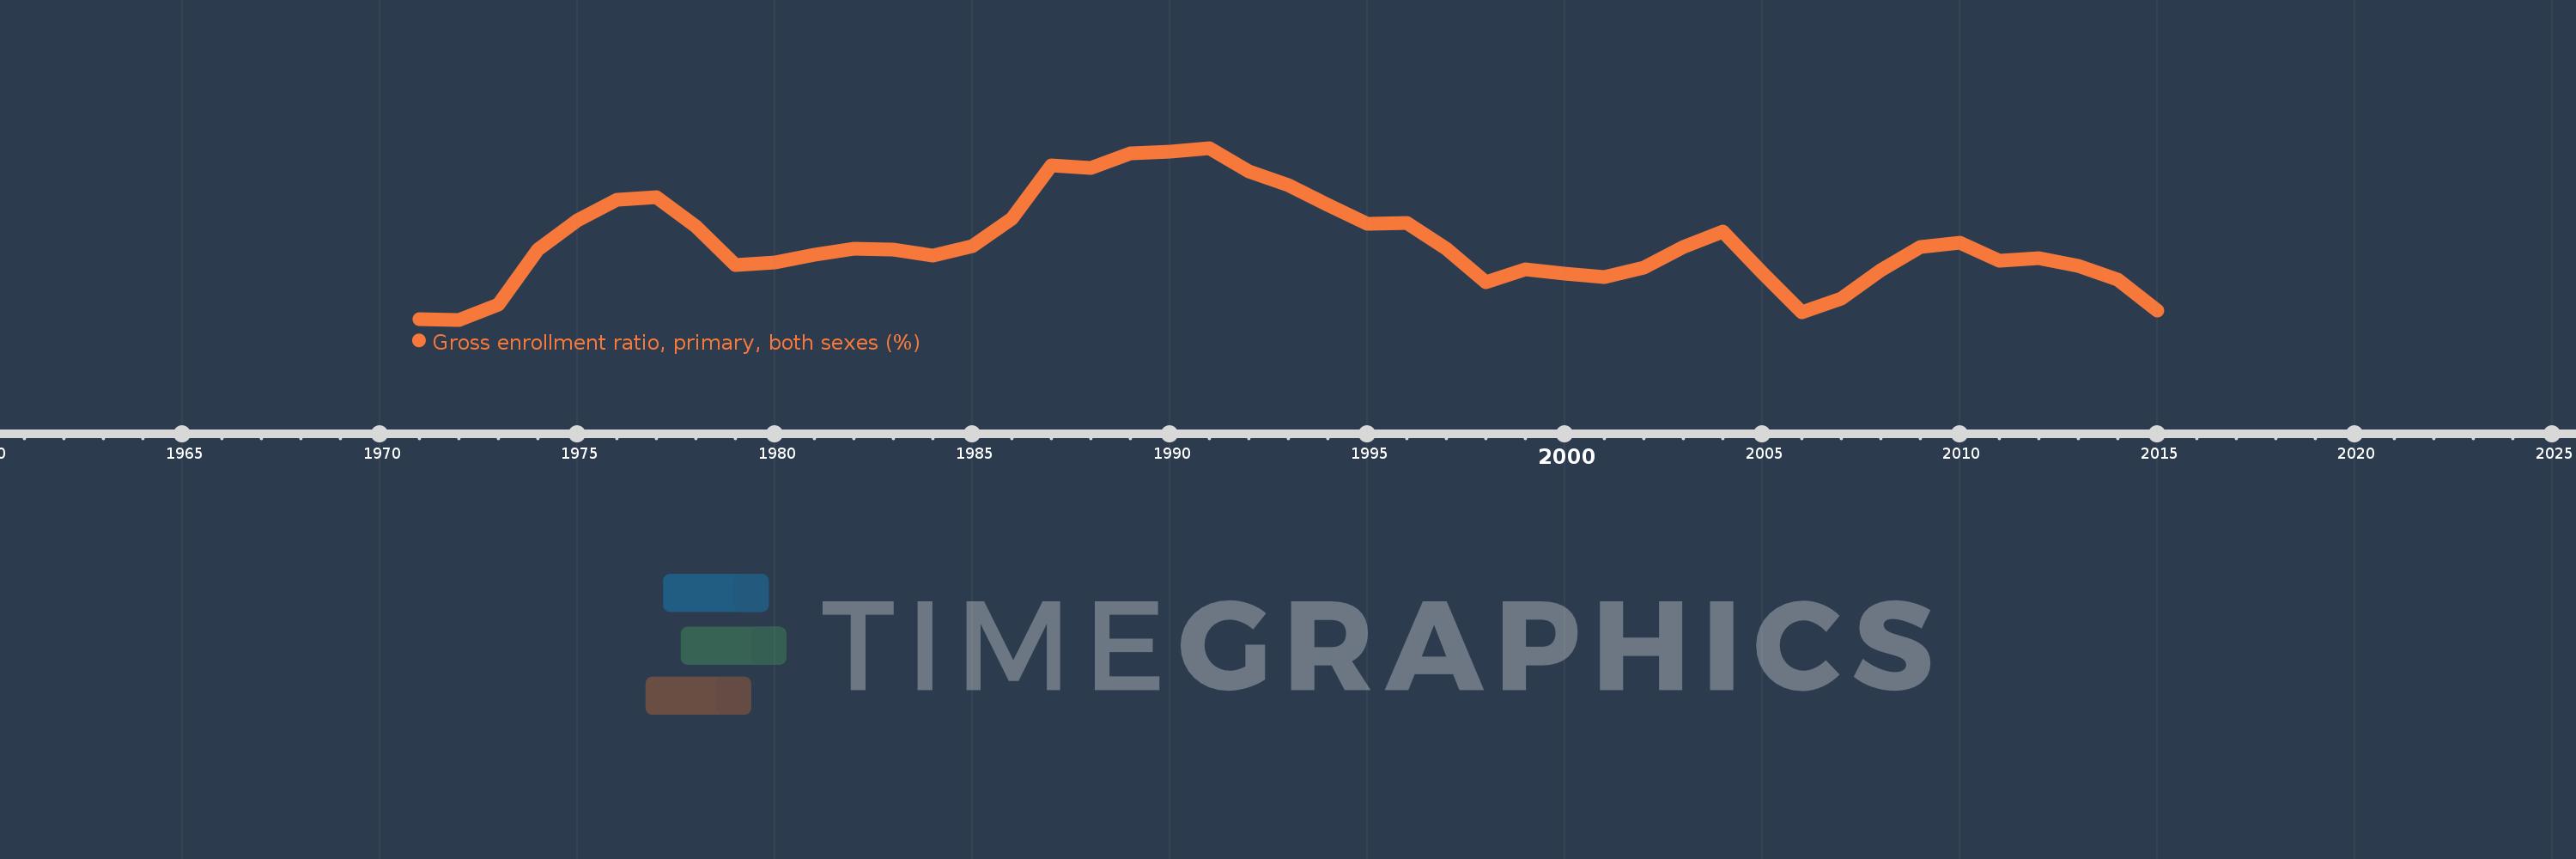
Gross enrollment ratio, primary, both sexes (%)
2015,2014,2013,2012,2011,2010,2009,2008,2007,2006,2005,2004,2003,2002,2001,2000,1999,1998,1997,1996,1995,1994,1993,1992,1991,1990,1989,1988,1987,1986,1985,1984,1983,1982,1981,1980,1979,1978,1977,1976,1975,1974,1973,1972,1971
This statistics in other country:
AfghanistanAlbaniaAlgeriaAndorraAngolaAntigua and BarbudaArab WorldArgentinaArmeniaArubaAustraliaAustriaAzerbaijanBahamas, TheBahrainBangladeshBarbadosBelarusBelgiumBelizeBeninBermudaBhutanBoliviaBosnia and HerzegovinaBotswanaBrazilBritish Virgin IslandsBrunei DarussalamBulgariaBurkina FasoBurundiCabo VerdeCambodiaCameroonCanadaCaribbean small statesCentral African RepublicCentral Europe and the BalticsChadChileChinaColombiaComorosCongo, Dem. Rep.Congo, Rep.Costa RicaCote d'IvoireCroatiaCubaCuracaoCyprusCzech RepublicDenmarkDjiboutiDominicaDominican RepublicEarly-demographic dividendEast Asia & PacificEast Asia & Pacific (excluding high income)East Asia & Pacific (IDA & IBRD countries)EcuadorEgypt, Arab Rep.El SalvadorEquatorial GuineaEritreaEstoniaEthiopiaEuro areaEurope & Central AsiaEurope & Central Asia (excluding high income)Europe & Central Asia (IDA & IBRD countries)European UnionFijiFinlandFragile and conflict affected situationsFranceGabonGambia, TheGeorgiaGermanyGhanaGreeceGrenadaGuatemalaGuineaGuinea-BissauGuyanaHaitiHeavily indebted poor countries (HIPC)High incomeHondurasHong Kong SAR, ChinaHungaryIBRD onlyIcelandIDA & IBRD totalIDA blendIDA onlyIDA totalIndiaIndonesiaIran, Islamic Rep.IraqIrelandIsraelItalyJamaicaJapanJordanKazakhstanKenyaKiribatiKorea, Dem. People’s Rep.Korea, Rep.KuwaitKyrgyz RepublicLao PDRLate-demographic dividendLatin America & Caribbean Latin America & Caribbean (excluding high income)Latin America & the Caribbean (IDA & IBRD countries)LatviaLeast developed countries: UN classificationLebanonLesothoLiberiaLibyaLiechtensteinLithuaniaLow & middle incomeLow incomeLower middle incomeLuxembourgMacao SAR, ChinaMacedonia, FYRMadagascarMalawiMalaysiaMaldivesMaliMaltaMarshall IslandsMauritaniaMauritiusMexicoMicronesia, Fed. Sts.Middle East & North AfricaMiddle East & North Africa (excluding high income)Middle East & North Africa (IDA & IBRD countries)Middle incomeMoldovaMongoliaMontenegroMoroccoMozambiqueMyanmarNamibiaNauruNepalNetherlandsNew ZealandNicaraguaNigerNigeriaNorth AmericaNorwayOECD membersOmanOther small statesPacific island small statesPakistanPalauPanamaPapua New GuineaParaguayPeruPhilippinesPolandPortugalPost-demographic dividendPre-demographic dividendPuerto RicoQatarRomaniaRussian FederationRwandaSamoaSan MarinoSao Tome and PrincipeSaudi ArabiaSenegalSerbiaSeychellesSierra LeoneSlovak RepublicSloveniaSmall statesSolomon IslandsSomaliaSouth AfricaSouth AsiaSouth Asia (IDA & IBRD)South SudanSpainSri LankaSt. Kitts and NevisSt. LuciaSt. Vincent and the GrenadinesSub-Saharan Africa Sub-Saharan Africa (excluding high income)Sub-Saharan Africa (IDA & IBRD countries)SudanSurinameSwazilandSwedenSwitzerlandSyrian Arab RepublicTajikistanTanzaniaThailandTimor-LesteTogoTongaTrinidad and TobagoTunisiaTurkeyTurkmenistanTuvaluUgandaUkraineUnited Arab EmiratesUnited KingdomUnited StatesUpper middle incomeUruguayUzbekistanVanuatuVenezuela, RBVietnamWest Bank and GazaWorldYemen, Rep.ZambiaZimbabwe Timeline:
This timeline shows a graph from 1971 to 2015 of Upper middle income. No data until 1970. Number of actual observations by date: 45.
Source name:
World Development Indicators
Source organization:
UNESCO Institute for Statistics
Categories, topics:
Education
Last updated:
apr 23, 2017
Indicators value changes by year
Minimum:
104.651
jan 1, 1972
Maximum:
119.302
jan 1, 1991
At the date of observation
Value
Absolute change
Change from previous value
jan 1, 1971
104.728
+104.728
0.0%
jan 1, 1972
104.651
-0.077
-0.07%
jan 1, 1973
105.957
+1.306
1.25%
jan 1, 1974
110.623
+4.666
4.4%
jan 1, 1975
113.134
+2.511
2.27%
jan 1, 1976
114.866
+1.732
1.53%
jan 1, 1977
115.1
+0.234
0.2%
jan 1, 1978
112.646
-2.454
-2.13%
jan 1, 1979
109.333
-3.313
-2.94%
jan 1, 1980
109.503
+0.17
0.16%
jan 1, 1981
110.216
+0.714
0.65%
jan 1, 1982
110.74
+0.523
0.47%
jan 1, 1983
110.606
-0.134
-0.12%
jan 1, 1984
110.109
-0.496
-0.45%
jan 1, 1985
110.897
+0.787
0.72%
jan 1, 1986
113.24
+2.343
2.11%
jan 1, 1987
117.803
+4.563
4.03%
jan 1, 1988
117.613
-0.19
-0.16%
jan 1, 1989
118.831
+1.218
1.04%
jan 1, 1990
119.004
+0.172
0.15%
jan 1, 1991
119.302
+0.298
0.25%
jan 1, 1992
117.325
-1.977
-1.66%
jan 1, 1993
116.094
-1.23
-1.05%
jan 1, 1994
114.468
-1.626
-1.4%
jan 1, 1995
112.802
-1.666
-1.46%
jan 1, 1996
112.92
+0.119
0.11%
jan 1, 1997
110.683
-2.237
-1.98%
jan 1, 1998
107.836
-2.848
-2.57%
jan 1, 1999
108.984
+1.148
1.06%
jan 1, 2000
108.621
-0.363
-0.33%
jan 1, 2001
108.322
-0.299
-0.28%
jan 1, 2002
109.098
+0.777
0.72%
jan 1, 2003
110.83
+1.732
1.59%
jan 1, 2004
112.162
+1.332
1.2%
jan 1, 2005
108.677
-3.485
-3.11%
jan 1, 2006
105.317
-3.36
-3.09%
jan 1, 2007
106.438
+1.121
1.06%
jan 1, 2008
108.868
+2.43
2.28%
jan 1, 2009
110.858
+1.99
1.83%
jan 1, 2010
111.233
+0.376
0.34%
jan 1, 2011
109.696
-1.537
-1.38%
jan 1, 2012
109.9
+0.203
0.19%
jan 1, 2013
109.268
-0.632
-0.57%
jan 1, 2014
108.067
-1.201
-1.1%
jan 1, 2015
105.469
-2.598
-2.4%
Ranking of countries by current statistics by years


Comments: