29
/
en
AIzaSyAYiBZKx7MnpbEhh9jyipgxe19OcubqV5w
April 1, 2024
31623
Europe & Central Asia (excluding high income)
ECA
false
2
1
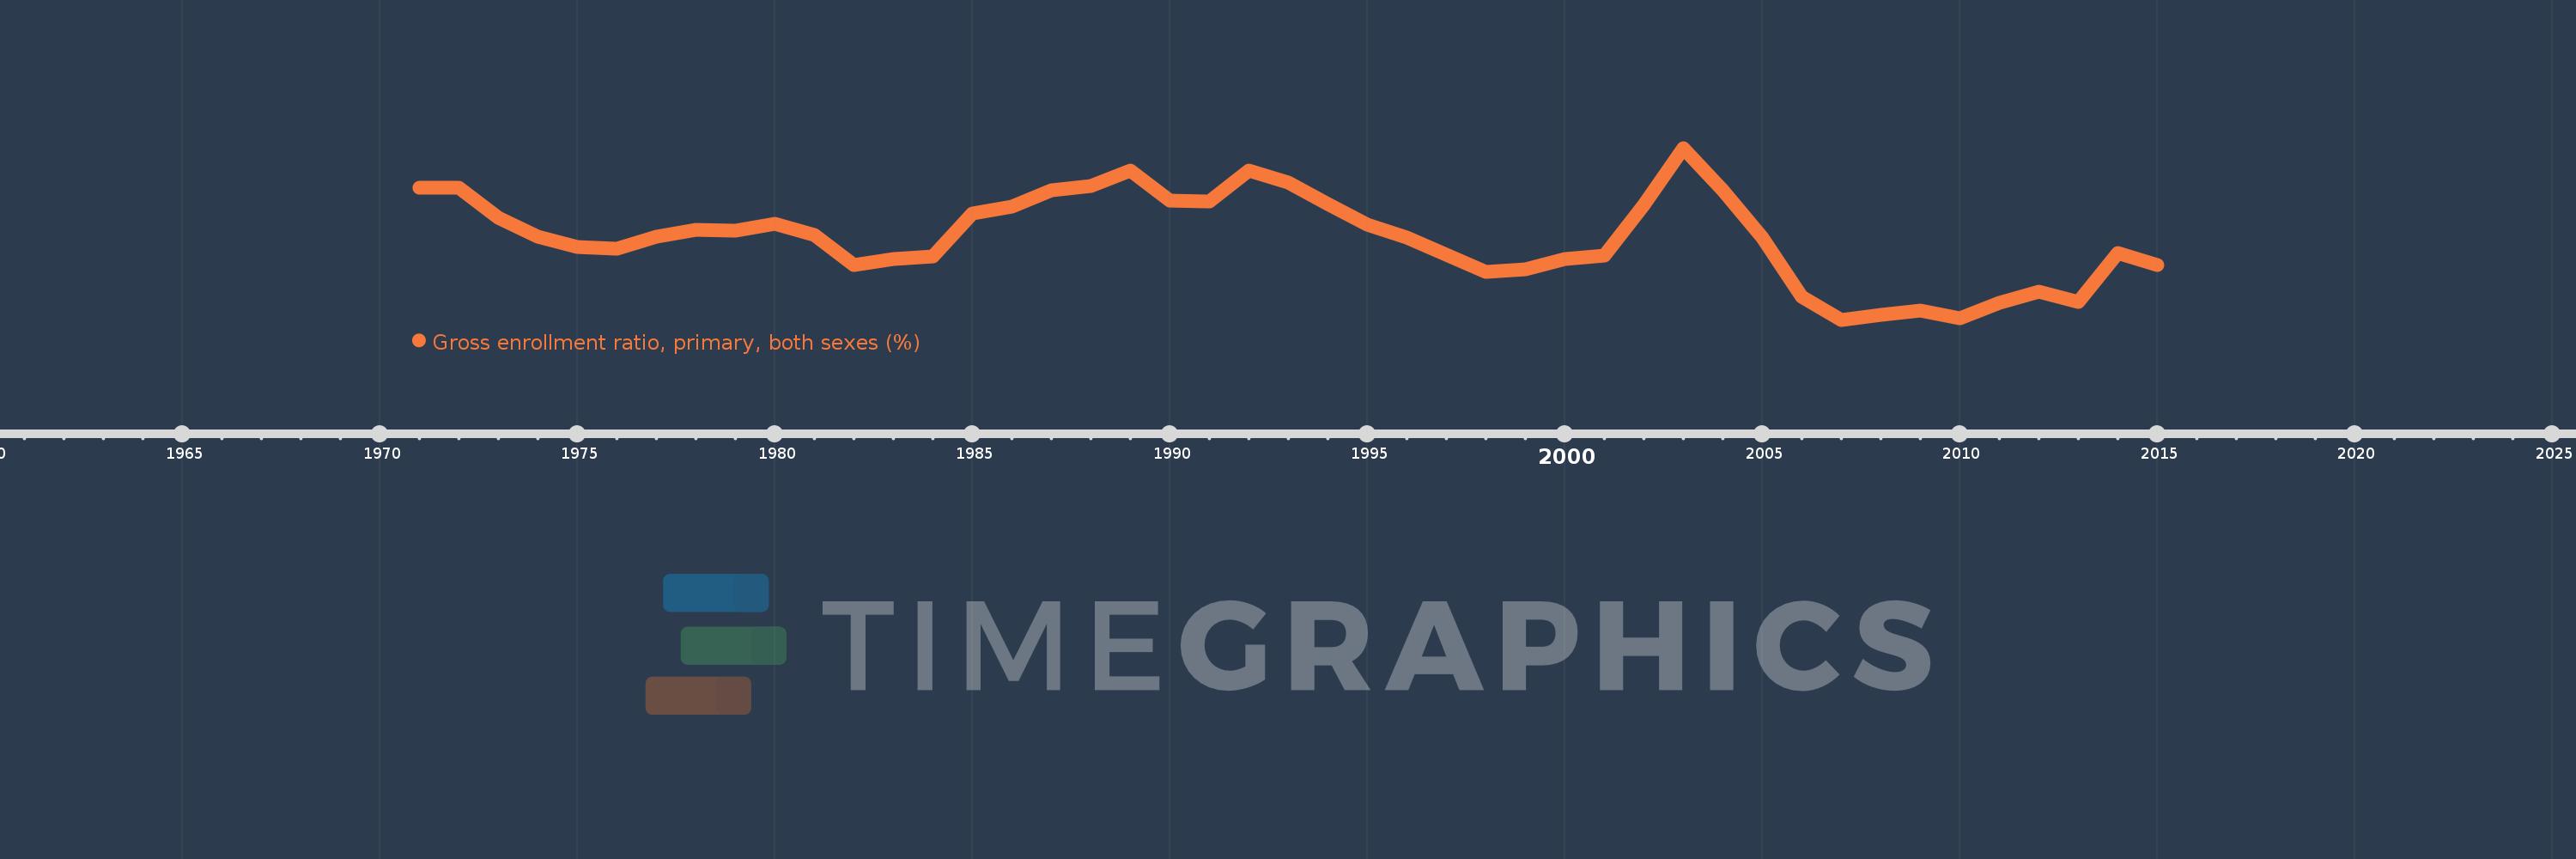
Gross enrollment ratio, primary, both sexes (%)
2015,2014,2013,2012,2011,2010,2009,2008,2007,2006,2005,2004,2003,2002,2001,2000,1999,1998,1997,1996,1995,1994,1993,1992,1991,1990,1989,1988,1987,1986,1985,1984,1983,1982,1981,1980,1979,1978,1977,1976,1975,1974,1973,1972,1971
This statistics in other country:
AfghanistanAlbaniaAlgeriaAndorraAngolaAntigua and BarbudaArab WorldArgentinaArmeniaArubaAustraliaAustriaAzerbaijanBahamas, TheBahrainBangladeshBarbadosBelarusBelgiumBelizeBeninBermudaBhutanBoliviaBosnia and HerzegovinaBotswanaBrazilBritish Virgin IslandsBrunei DarussalamBulgariaBurkina FasoBurundiCabo VerdeCambodiaCameroonCanadaCaribbean small statesCentral African RepublicCentral Europe and the BalticsChadChileChinaColombiaComorosCongo, Dem. Rep.Congo, Rep.Costa RicaCote d'IvoireCroatiaCubaCuracaoCyprusCzech RepublicDenmarkDjiboutiDominicaDominican RepublicEarly-demographic dividendEast Asia & PacificEast Asia & Pacific (excluding high income)East Asia & Pacific (IDA & IBRD countries)EcuadorEgypt, Arab Rep.El SalvadorEquatorial GuineaEritreaEstoniaEthiopiaEuro areaEurope & Central AsiaEurope & Central Asia (excluding high income)Europe & Central Asia (IDA & IBRD countries)European UnionFijiFinlandFragile and conflict affected situationsFranceGabonGambia, TheGeorgiaGermanyGhanaGreeceGrenadaGuatemalaGuineaGuinea-BissauGuyanaHaitiHeavily indebted poor countries (HIPC)High incomeHondurasHong Kong SAR, ChinaHungaryIBRD onlyIcelandIDA & IBRD totalIDA blendIDA onlyIDA totalIndiaIndonesiaIran, Islamic Rep.IraqIrelandIsraelItalyJamaicaJapanJordanKazakhstanKenyaKiribatiKorea, Dem. People’s Rep.Korea, Rep.KuwaitKyrgyz RepublicLao PDRLate-demographic dividendLatin America & Caribbean Latin America & Caribbean (excluding high income)Latin America & the Caribbean (IDA & IBRD countries)LatviaLeast developed countries: UN classificationLebanonLesothoLiberiaLibyaLiechtensteinLithuaniaLow & middle incomeLow incomeLower middle incomeLuxembourgMacao SAR, ChinaMacedonia, FYRMadagascarMalawiMalaysiaMaldivesMaliMaltaMarshall IslandsMauritaniaMauritiusMexicoMicronesia, Fed. Sts.Middle East & North AfricaMiddle East & North Africa (excluding high income)Middle East & North Africa (IDA & IBRD countries)Middle incomeMoldovaMongoliaMontenegroMoroccoMozambiqueMyanmarNamibiaNauruNepalNetherlandsNew ZealandNicaraguaNigerNigeriaNorth AmericaNorwayOECD membersOmanOther small statesPacific island small statesPakistanPalauPanamaPapua New GuineaParaguayPeruPhilippinesPolandPortugalPost-demographic dividendPre-demographic dividendPuerto RicoQatarRomaniaRussian FederationRwandaSamoaSan MarinoSao Tome and PrincipeSaudi ArabiaSenegalSerbiaSeychellesSierra LeoneSlovak RepublicSloveniaSmall statesSolomon IslandsSomaliaSouth AfricaSouth AsiaSouth Asia (IDA & IBRD)South SudanSpainSri LankaSt. Kitts and NevisSt. LuciaSt. Vincent and the GrenadinesSub-Saharan Africa Sub-Saharan Africa (excluding high income)Sub-Saharan Africa (IDA & IBRD countries)SudanSurinameSwazilandSwedenSwitzerlandSyrian Arab RepublicTajikistanTanzaniaThailandTimor-LesteTogoTongaTrinidad and TobagoTunisiaTurkeyTurkmenistanTuvaluUgandaUkraineUnited Arab EmiratesUnited KingdomUnited StatesUpper middle incomeUruguayUzbekistanVanuatuVenezuela, RBVietnamWest Bank and GazaWorldYemen, Rep.ZambiaZimbabwe Timeline:
This timeline shows a graph from 1971 to 2015 of Europe & Central Asia (excluding high income). No data until 1970. Number of actual observations by date: 45.
Source name:
World Development Indicators
Source organization:
UNESCO Institute for Statistics
Categories, topics:
Education
Last updated:
apr 23, 2017
Indicators value changes by year
Minimum:
99.449
jan 1, 2007
Maximum:
106.881
jan 1, 2003
At the date of observation
Value
Absolute change
Change from previous value
jan 1, 1971
105.169
+105.169
0.0%
jan 1, 1972
105.152
-0.017
-0.02%
jan 1, 1973
103.872
-1.281
-1.22%
jan 1, 1974
103.055
-0.816
-0.79%
jan 1, 1975
102.609
-0.446
-0.43%
jan 1, 1976
102.529
-0.08
-0.08%
jan 1, 1977
103.025
+0.496
0.48%
jan 1, 1978
103.329
+0.304
0.29%
jan 1, 1979
103.314
-0.015
-0.01%
jan 1, 1980
103.607
+0.293
0.28%
jan 1, 1981
103.125
-0.482
-0.47%
jan 1, 1982
101.801
-1.324
-1.28%
jan 1, 1983
102.085
+0.284
0.28%
jan 1, 1984
102.18
+0.095
0.09%
jan 1, 1985
104.031
+1.851
1.81%
jan 1, 1986
104.339
+0.308
0.3%
jan 1, 1987
105.037
+0.698
0.67%
jan 1, 1988
105.22
+0.182
0.17%
jan 1, 1989
105.889
+0.67
0.64%
jan 1, 1990
104.588
-1.302
-1.23%
jan 1, 1991
104.562
-0.025
-0.02%
jan 1, 1992
105.922
+1.36
1.3%
jan 1, 1993
105.37
-0.553
-0.52%
jan 1, 1994
104.445
-0.925
-0.88%
jan 1, 1995
103.566
-0.878
-0.84%
jan 1, 1996
103.01
-0.556
-0.54%
jan 1, 1997
102.25
-0.76
-0.74%
jan 1, 1998
101.537
-0.713
-0.7%
jan 1, 1999
101.634
+0.098
0.1%
jan 1, 2000
102.061
+0.426
0.42%
jan 1, 2001
102.237
+0.176
0.17%
jan 1, 2002
104.403
+2.167
2.12%
jan 1, 2003
106.881
+2.478
2.37%
jan 1, 2004
105.051
-1.83
-1.71%
jan 1, 2005
102.992
-2.059
-1.96%
jan 1, 2006
100.434
-2.558
-2.48%
jan 1, 2007
99.449
-0.985
-0.98%
jan 1, 2008
99.663
+0.214
0.22%
jan 1, 2009
99.851
+0.189
0.19%
jan 1, 2010
99.496
-0.355
-0.36%
jan 1, 2011
100.164
+0.668
0.67%
jan 1, 2012
100.681
+0.517
0.52%
jan 1, 2013
100.21
-0.471
-0.47%
jan 1, 2014
102.349
+2.139
2.13%
jan 1, 2015
101.798
-0.55
-0.54%
Ranking of countries by current statistics by years


Comments: