29
/
en
AIzaSyAYiBZKx7MnpbEhh9jyipgxe19OcubqV5w
April 1, 2024
112300
Costa Rica
CRI
true
2
1
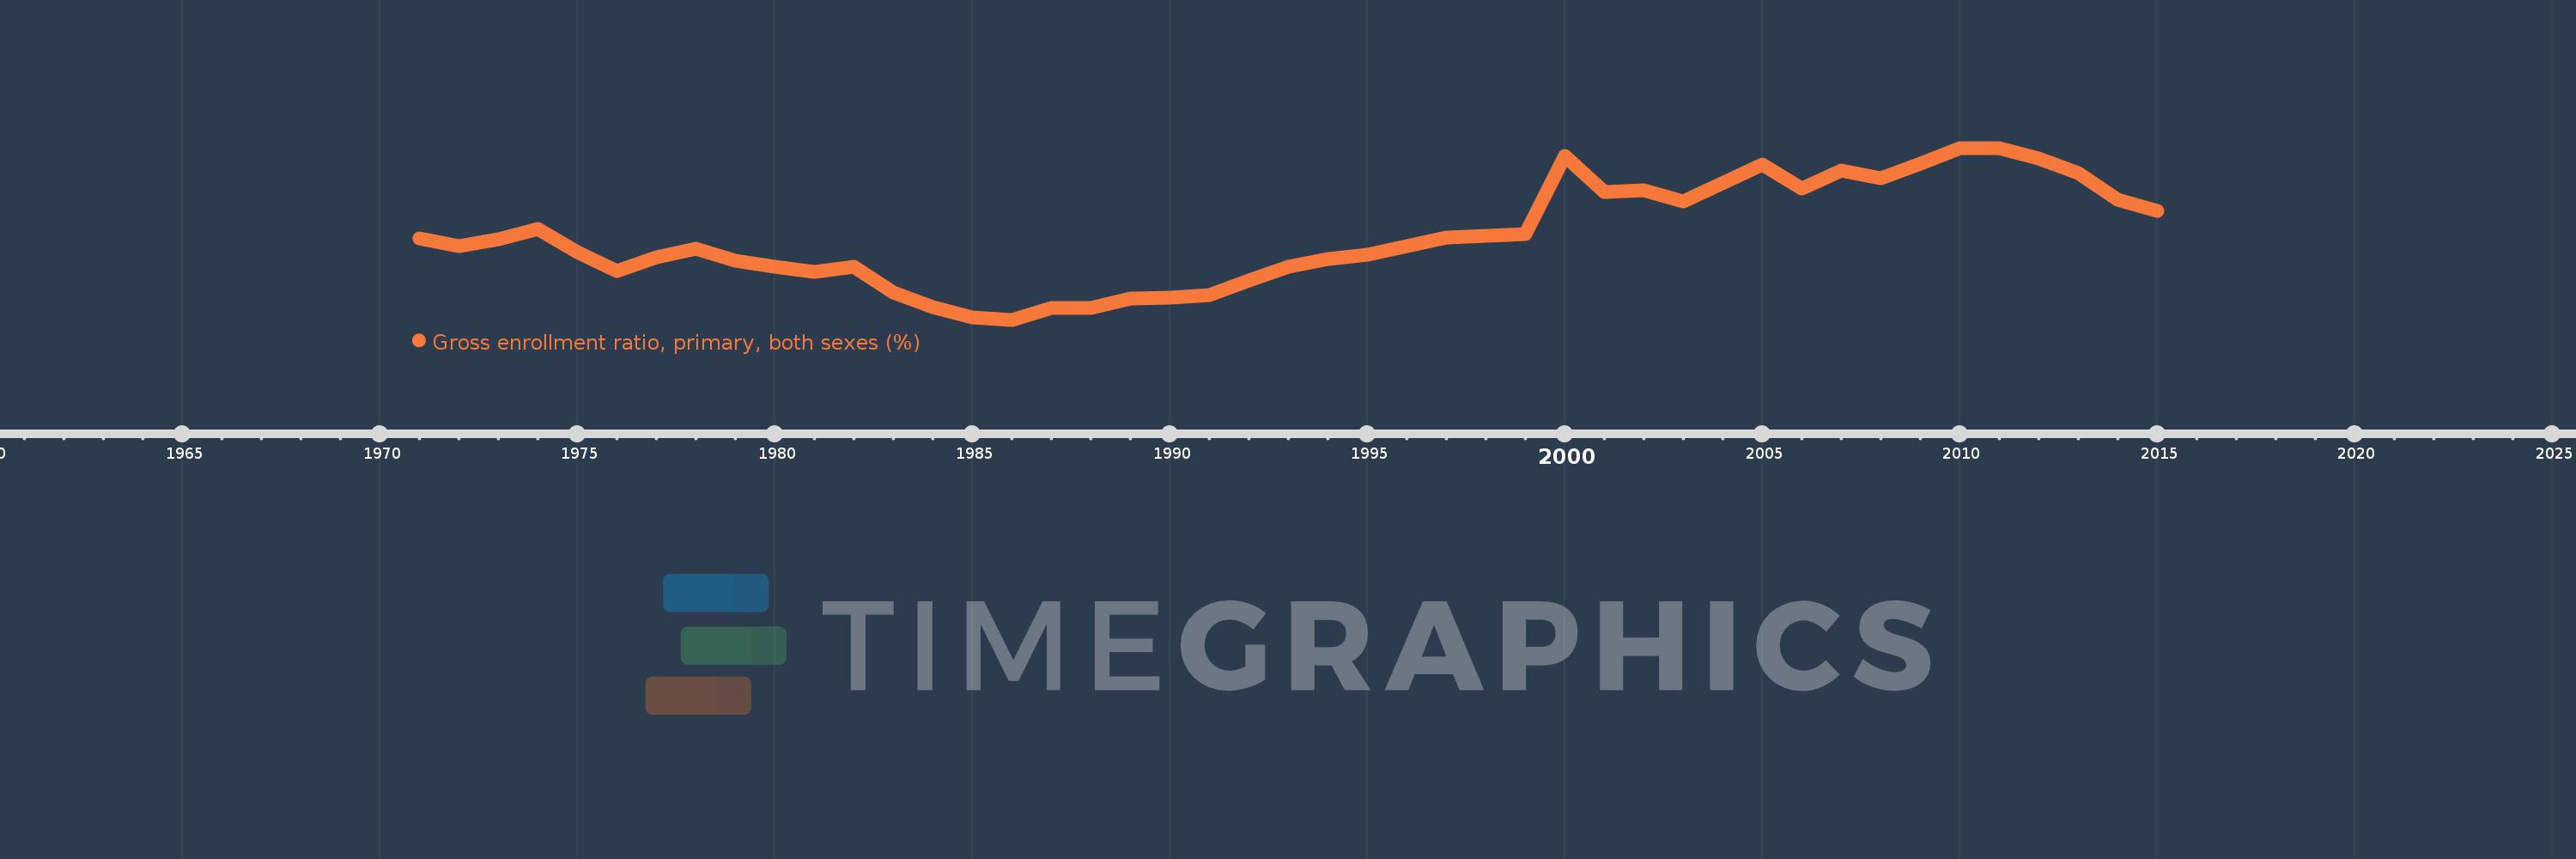
Gross enrollment ratio, primary, both sexes (%)
2015,2014,2013,2012,2011,2010,2009,2008,2007,2006,2005,2003,2002,2001,2000,1999,1998,1997,1996,1995,1994,1993,1992,1991,1990,1989,1988,1987,1986,1985,1984,1983,1982,1981,1980,1979,1978,1977,1976,1975,1974,1973,1972,1971
This statistics in other country:
AfghanistanAlbaniaAlgeriaAndorraAngolaAntigua and BarbudaArab WorldArgentinaArmeniaArubaAustraliaAustriaAzerbaijanBahamas, TheBahrainBangladeshBarbadosBelarusBelgiumBelizeBeninBermudaBhutanBoliviaBosnia and HerzegovinaBotswanaBrazilBritish Virgin IslandsBrunei DarussalamBulgariaBurkina FasoBurundiCabo VerdeCambodiaCameroonCanadaCaribbean small statesCentral African RepublicCentral Europe and the BalticsChadChileChinaColombiaComorosCongo, Dem. Rep.Congo, Rep.Costa RicaCote d'IvoireCroatiaCubaCuracaoCyprusCzech RepublicDenmarkDjiboutiDominicaDominican RepublicEarly-demographic dividendEast Asia & PacificEast Asia & Pacific (excluding high income)East Asia & Pacific (IDA & IBRD countries)EcuadorEgypt, Arab Rep.El SalvadorEquatorial GuineaEritreaEstoniaEthiopiaEuro areaEurope & Central AsiaEurope & Central Asia (excluding high income)Europe & Central Asia (IDA & IBRD countries)European UnionFijiFinlandFragile and conflict affected situationsFranceGabonGambia, TheGeorgiaGermanyGhanaGreeceGrenadaGuatemalaGuineaGuinea-BissauGuyanaHaitiHeavily indebted poor countries (HIPC)High incomeHondurasHong Kong SAR, ChinaHungaryIBRD onlyIcelandIDA & IBRD totalIDA blendIDA onlyIDA totalIndiaIndonesiaIran, Islamic Rep.IraqIrelandIsraelItalyJamaicaJapanJordanKazakhstanKenyaKiribatiKorea, Dem. People’s Rep.Korea, Rep.KuwaitKyrgyz RepublicLao PDRLate-demographic dividendLatin America & Caribbean Latin America & Caribbean (excluding high income)Latin America & the Caribbean (IDA & IBRD countries)LatviaLeast developed countries: UN classificationLebanonLesothoLiberiaLibyaLiechtensteinLithuaniaLow & middle incomeLow incomeLower middle incomeLuxembourgMacao SAR, ChinaMacedonia, FYRMadagascarMalawiMalaysiaMaldivesMaliMaltaMarshall IslandsMauritaniaMauritiusMexicoMicronesia, Fed. Sts.Middle East & North AfricaMiddle East & North Africa (excluding high income)Middle East & North Africa (IDA & IBRD countries)Middle incomeMoldovaMongoliaMontenegroMoroccoMozambiqueMyanmarNamibiaNauruNepalNetherlandsNew ZealandNicaraguaNigerNigeriaNorth AmericaNorwayOECD membersOmanOther small statesPacific island small statesPakistanPalauPanamaPapua New GuineaParaguayPeruPhilippinesPolandPortugalPost-demographic dividendPre-demographic dividendPuerto RicoQatarRomaniaRussian FederationRwandaSamoaSan MarinoSao Tome and PrincipeSaudi ArabiaSenegalSerbiaSeychellesSierra LeoneSlovak RepublicSloveniaSmall statesSolomon IslandsSomaliaSouth AfricaSouth AsiaSouth Asia (IDA & IBRD)South SudanSpainSri LankaSt. Kitts and NevisSt. LuciaSt. Vincent and the GrenadinesSub-Saharan Africa Sub-Saharan Africa (excluding high income)Sub-Saharan Africa (IDA & IBRD countries)SudanSurinameSwazilandSwedenSwitzerlandSyrian Arab RepublicTajikistanTanzaniaThailandTimor-LesteTogoTongaTrinidad and TobagoTunisiaTurkeyTurkmenistanTuvaluUgandaUkraineUnited Arab EmiratesUnited KingdomUnited StatesUpper middle incomeUruguayUzbekistanVanuatuVenezuela, RBVietnamWest Bank and GazaWorldYemen, Rep.ZambiaZimbabwe Timeline:
This timeline shows a graph from 1971 to 2015 of Costa Rica. No data until 1970. Number of actual observations by date: 44.
Source name:
World Development Indicators
Source organization:
UNESCO Institute for Statistics
Categories, topics:
Education
Last updated:
apr 23, 2017
Indicators value changes by year
Maximum:
117.032
jan 1, 2010
At the date of observation
Value
Absolute change
Change from previous value
jan 1, 1971
108.052
+108.052
0.0%
jan 1, 1972
107.285
-0.767
-0.71%
jan 1, 1973
107.937
+0.652
0.61%
jan 1, 1974
108.97
+1.033
0.96%
jan 1, 1975
106.624
-2.346
-2.15%
jan 1, 1976
104.811
-1.813
-1.7%
jan 1, 1977
106.167
+1.356
1.29%
jan 1, 1978
106.998
+0.831
0.78%
jan 1, 1979
105.782
-1.216
-1.14%
jan 1, 1980
105.228
-0.554
-0.52%
jan 1, 1981
104.725
-0.502
-0.48%
jan 1, 1982
105.232
+0.506
0.48%
jan 1, 1983
102.645
-2.587
-2.46%
jan 1, 1984
101.149
-1.495
-1.46%
jan 1, 1985
100.136
-1.013
-1.0%
jan 1, 1986
99.92
-0.216
-0.22%
jan 1, 1987
101.08
+1.16
1.16%
jan 1, 1988
101.094
+0.014
0.01%
jan 1, 1989
102.053
+0.959
0.95%
jan 1, 1990
102.117
+0.064
0.06%
jan 1, 1991
102.402
+0.285
0.28%
jan 1, 1992
103.797
+1.395
1.36%
jan 1, 1993
105.225
+1.429
1.38%
jan 1, 1994
106.005
+0.78
0.74%
jan 1, 1995
106.438
+0.433
0.41%
jan 1, 1996
107.243
+0.805
0.76%
jan 1, 1997
108.117
+0.874
0.81%
jan 1, 1998
108.309
+0.192
0.18%
jan 1, 1999
108.425
+0.116
0.11%
jan 1, 2000
116.22
+7.795
7.19%
jan 1, 2001
112.61
-3.61
-3.11%
jan 1, 2002
112.837
+0.228
0.2%
jan 1, 2003
111.708
-1.129
-1.0%
jan 1, 2005
115.407
+3.699
3.31%
jan 1, 2006
112.971
-2.436
-2.11%
jan 1, 2007
114.782
+1.811
1.6%
jan 1, 2008
114.011
-0.771
-0.67%
jan 1, 2009
115.487
+1.475
1.29%
jan 1, 2010
117.032
+1.545
1.34%
jan 1, 2011
116.994
-0.038
-0.03%
jan 1, 2012
115.975
-1.019
-0.87%
jan 1, 2013
114.554
-1.421
-1.23%
jan 1, 2014
111.833
-2.721
-2.38%
jan 1, 2015
110.787
-1.046
-0.94%
Ranking of countries by current statistics by years


Comments: