29
/
en
AIzaSyAYiBZKx7MnpbEhh9jyipgxe19OcubqV5w
April 1, 2024
69863
Argentina
ARG
true
2
1
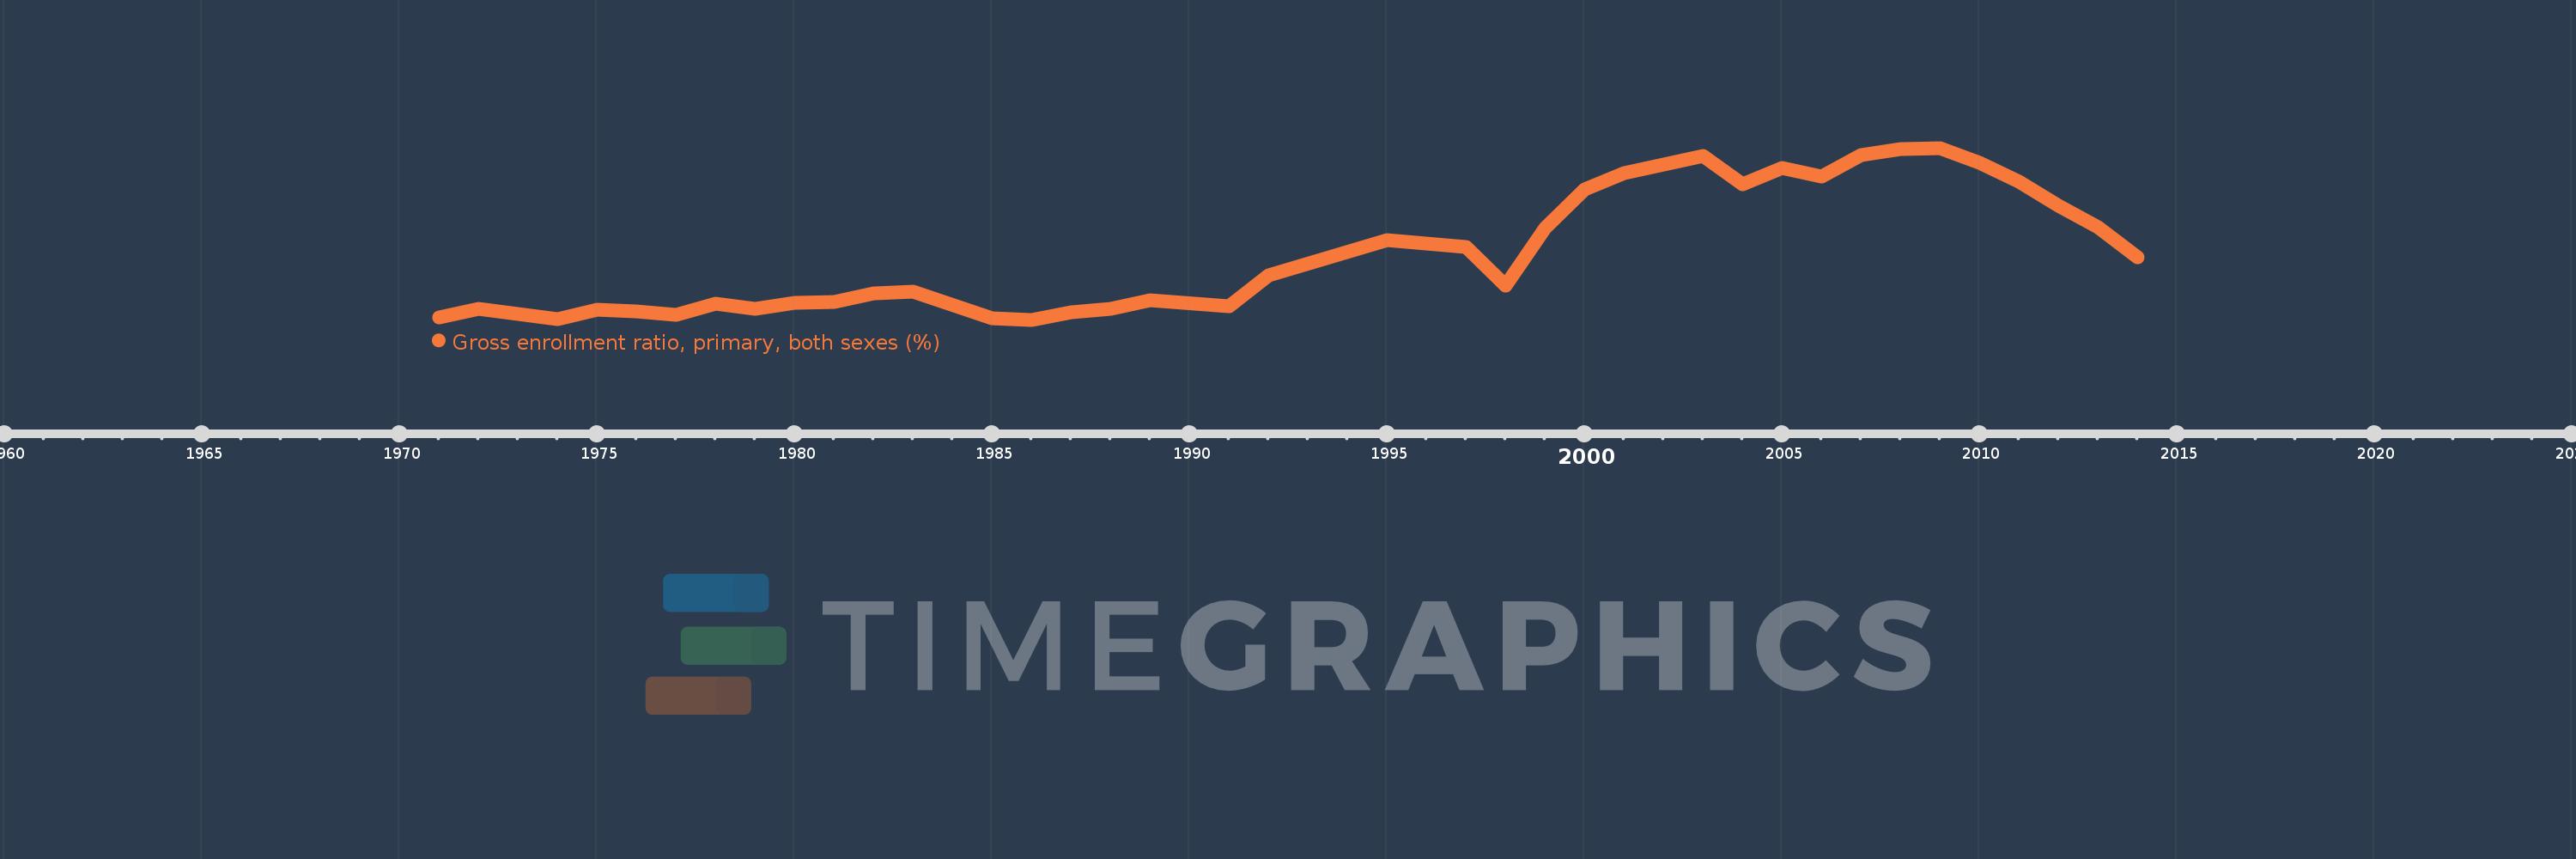
Gross enrollment ratio, primary, both sexes (%)
2014,2013,2012,2011,2010,2009,2008,2007,2006,2005,2004,2003,2002,2001,2000,1999,1998,1997,1995,1992,1991,1989,1988,1987,1986,1985,1983,1982,1981,1980,1979,1978,1977,1976,1975,1974,1973,1972,1971
This statistics in other country:
AfghanistanAlbaniaAlgeriaAndorraAngolaAntigua and BarbudaArab WorldArgentinaArmeniaArubaAustraliaAustriaAzerbaijanBahamas, TheBahrainBangladeshBarbadosBelarusBelgiumBelizeBeninBermudaBhutanBoliviaBosnia and HerzegovinaBotswanaBrazilBritish Virgin IslandsBrunei DarussalamBulgariaBurkina FasoBurundiCabo VerdeCambodiaCameroonCanadaCaribbean small statesCentral African RepublicCentral Europe and the BalticsChadChileChinaColombiaComorosCongo, Dem. Rep.Congo, Rep.Costa RicaCote d'IvoireCroatiaCubaCuracaoCyprusCzech RepublicDenmarkDjiboutiDominicaDominican RepublicEarly-demographic dividendEast Asia & PacificEast Asia & Pacific (excluding high income)East Asia & Pacific (IDA & IBRD countries)EcuadorEgypt, Arab Rep.El SalvadorEquatorial GuineaEritreaEstoniaEthiopiaEuro areaEurope & Central AsiaEurope & Central Asia (excluding high income)Europe & Central Asia (IDA & IBRD countries)European UnionFijiFinlandFragile and conflict affected situationsFranceGabonGambia, TheGeorgiaGermanyGhanaGreeceGrenadaGuatemalaGuineaGuinea-BissauGuyanaHaitiHeavily indebted poor countries (HIPC)High incomeHondurasHong Kong SAR, ChinaHungaryIBRD onlyIcelandIDA & IBRD totalIDA blendIDA onlyIDA totalIndiaIndonesiaIran, Islamic Rep.IraqIrelandIsraelItalyJamaicaJapanJordanKazakhstanKenyaKiribatiKorea, Dem. People’s Rep.Korea, Rep.KuwaitKyrgyz RepublicLao PDRLate-demographic dividendLatin America & Caribbean Latin America & Caribbean (excluding high income)Latin America & the Caribbean (IDA & IBRD countries)LatviaLeast developed countries: UN classificationLebanonLesothoLiberiaLibyaLiechtensteinLithuaniaLow & middle incomeLow incomeLower middle incomeLuxembourgMacao SAR, ChinaMacedonia, FYRMadagascarMalawiMalaysiaMaldivesMaliMaltaMarshall IslandsMauritaniaMauritiusMexicoMicronesia, Fed. Sts.Middle East & North AfricaMiddle East & North Africa (excluding high income)Middle East & North Africa (IDA & IBRD countries)Middle incomeMoldovaMongoliaMontenegroMoroccoMozambiqueMyanmarNamibiaNauruNepalNetherlandsNew ZealandNicaraguaNigerNigeriaNorth AmericaNorwayOECD membersOmanOther small statesPacific island small statesPakistanPalauPanamaPapua New GuineaParaguayPeruPhilippinesPolandPortugalPost-demographic dividendPre-demographic dividendPuerto RicoQatarRomaniaRussian FederationRwandaSamoaSan MarinoSao Tome and PrincipeSaudi ArabiaSenegalSerbiaSeychellesSierra LeoneSlovak RepublicSloveniaSmall statesSolomon IslandsSomaliaSouth AfricaSouth AsiaSouth Asia (IDA & IBRD)South SudanSpainSri LankaSt. Kitts and NevisSt. LuciaSt. Vincent and the GrenadinesSub-Saharan Africa Sub-Saharan Africa (excluding high income)Sub-Saharan Africa (IDA & IBRD countries)SudanSurinameSwazilandSwedenSwitzerlandSyrian Arab RepublicTajikistanTanzaniaThailandTimor-LesteTogoTongaTrinidad and TobagoTunisiaTurkeyTurkmenistanTuvaluUgandaUkraineUnited Arab EmiratesUnited KingdomUnited StatesUpper middle incomeUruguayUzbekistanVanuatuVenezuela, RBVietnamWest Bank and GazaWorldYemen, Rep.ZambiaZimbabwe Timeline:
This timeline shows a graph from 1971 to 2014 of Argentina. No data until 1970. Number of actual observations by date: 39.
Source name:
World Development Indicators
Source organization:
UNESCO Institute for Statistics
Categories, topics:
Education
Last updated:
apr 23, 2017
Indicators value changes by year
Minimum:
105.47
jan 1, 1986
Maximum:
119.441
jan 1, 2009
At the date of observation
Value
Absolute change
Change from previous value
jan 1, 1971
105.65
+105.65
0.0%
jan 1, 1972
106.379
+0.729
0.69%
jan 1, 1973
105.942
-0.437
-0.41%
jan 1, 1974
105.53
-0.412
-0.39%
jan 1, 1975
106.311
+0.781
0.74%
jan 1, 1976
106.164
-0.147
-0.14%
jan 1, 1977
105.86
-0.304
-0.29%
jan 1, 1978
106.78
+0.92
0.87%
jan 1, 1979
106.381
-0.399
-0.37%
jan 1, 1980
106.827
+0.445
0.42%
jan 1, 1981
106.885
+0.058
0.05%
jan 1, 1982
107.623
+0.738
0.69%
jan 1, 1983
107.775
+0.152
0.14%
jan 1, 1985
105.562
-2.213
-2.05%
jan 1, 1986
105.47
-0.092
-0.09%
jan 1, 1987
106.078
+0.608
0.58%
jan 1, 1988
106.361
+0.283
0.27%
jan 1, 1989
107.024
+0.664
0.62%
jan 1, 1991
106.562
-0.463
-0.43%
jan 1, 1992
109.086
+2.524
2.37%
jan 1, 1995
111.944
+2.858
2.62%
jan 1, 1997
111.368
-0.576
-0.51%
jan 1, 1998
108.267
-3.101
-2.78%
jan 1, 1999
112.947
+4.68
4.32%
jan 1, 2000
116.053
+3.106
2.75%
jan 1, 2001
117.363
+1.311
1.13%
jan 1, 2002
118.065
+0.701
0.6%
jan 1, 2003
118.759
+0.694
0.59%
jan 1, 2004
116.501
-2.257
-1.9%
jan 1, 2005
117.814
+1.312
1.13%
jan 1, 2006
117.133
-0.68
-0.58%
jan 1, 2007
118.835
+1.702
1.45%
jan 1, 2008
119.349
+0.513
0.43%
jan 1, 2009
119.441
+0.092
0.08%
jan 1, 2010
118.211
-1.23
-1.03%
jan 1, 2011
116.718
-1.493
-1.26%
jan 1, 2012
114.768
-1.95
-1.67%
jan 1, 2013
112.978
-1.79
-1.56%
jan 1, 2014
110.566
-2.412
-2.14%
Ranking of countries by current statistics by years


Comments: