29
/
en
AIzaSyAYiBZKx7MnpbEhh9jyipgxe19OcubqV5w
April 1, 2024
153592
Iceland
ISL
true
2
1
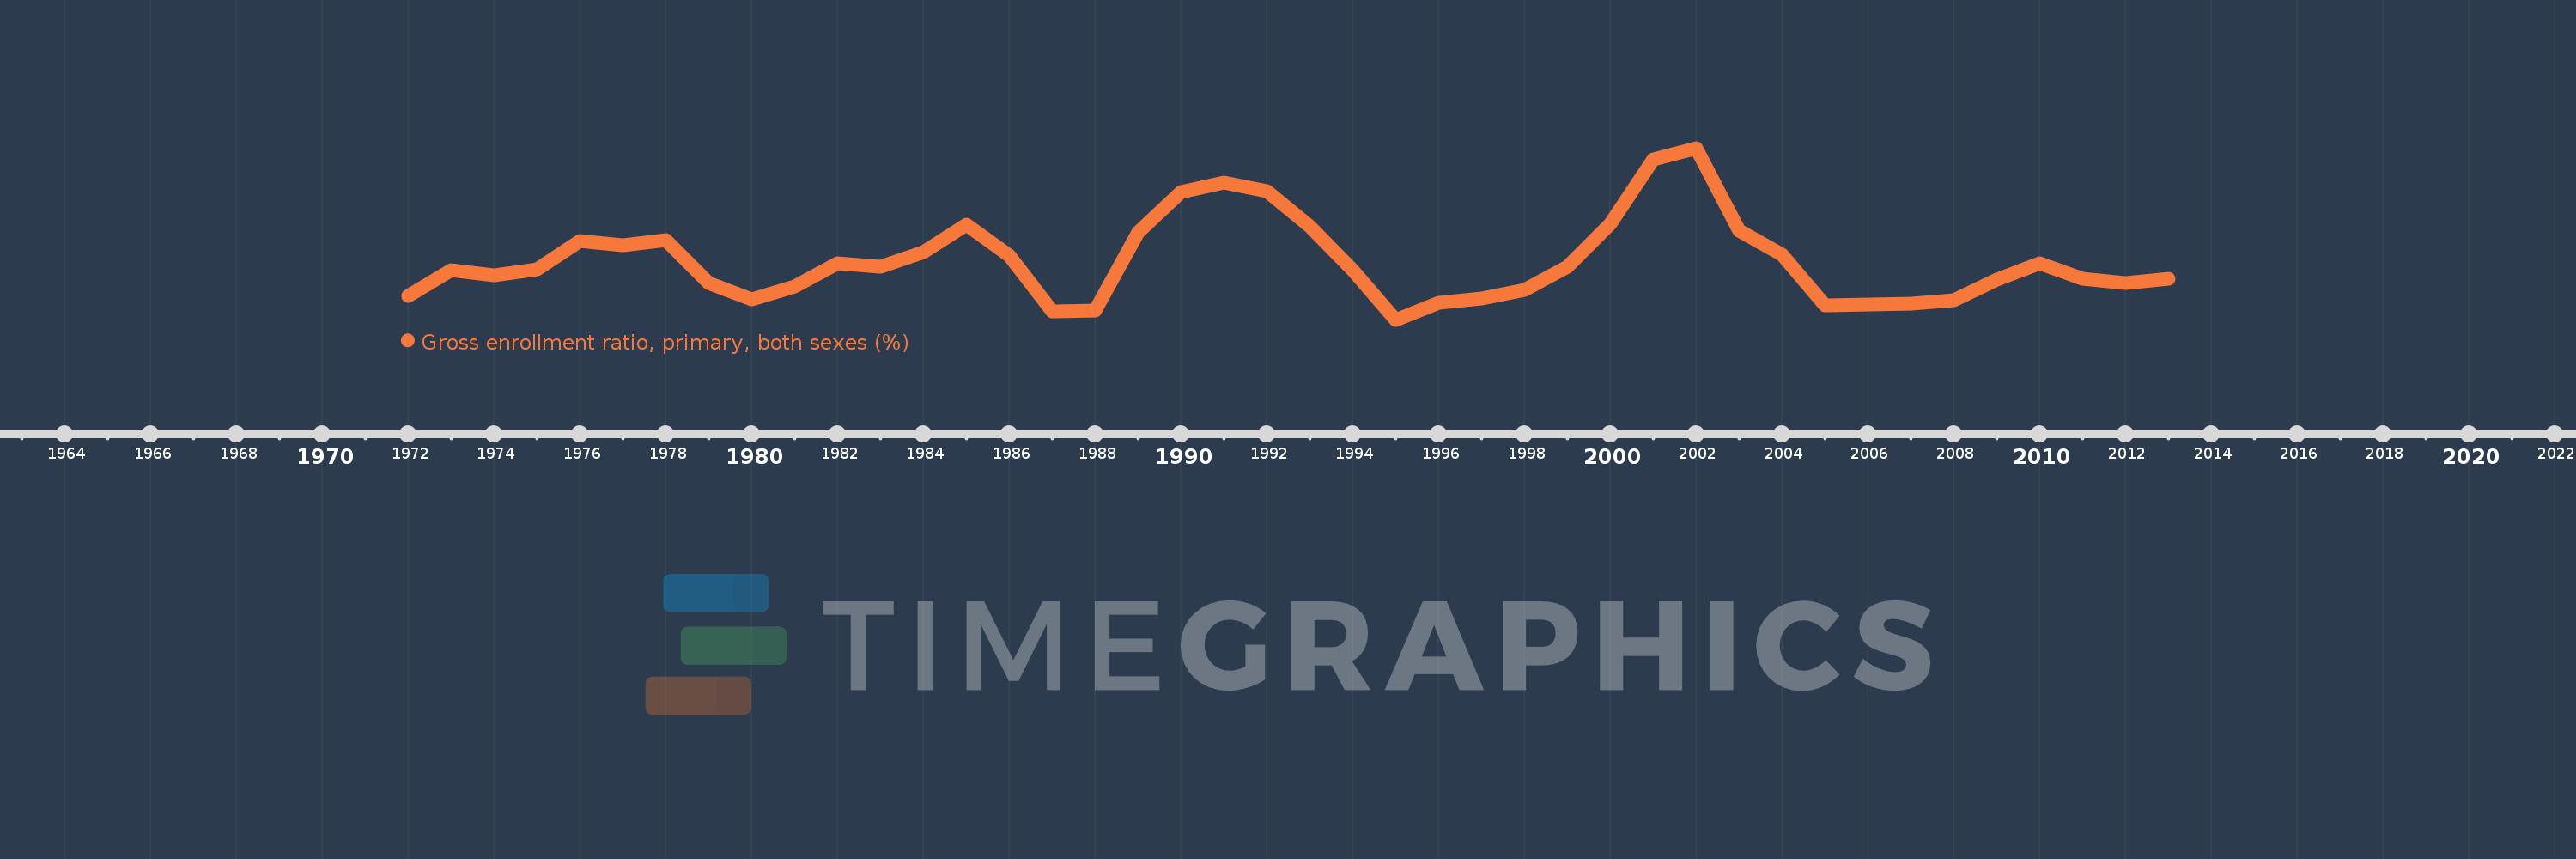
Gross enrollment ratio, primary, both sexes (%)
2013,2012,2011,2010,2009,2008,2007,2006,2005,2004,2003,2002,2001,2000,1999,1998,1997,1996,1995,1994,1993,1992,1991,1990,1989,1988,1987,1986,1985,1984,1983,1982,1981,1980,1979,1978,1977,1976,1975,1974,1973,1972
This statistics in other country:
AfghanistanAlbaniaAlgeriaAndorraAngolaAntigua and BarbudaArab WorldArgentinaArmeniaArubaAustraliaAustriaAzerbaijanBahamas, TheBahrainBangladeshBarbadosBelarusBelgiumBelizeBeninBermudaBhutanBoliviaBosnia and HerzegovinaBotswanaBrazilBritish Virgin IslandsBrunei DarussalamBulgariaBurkina FasoBurundiCabo VerdeCambodiaCameroonCanadaCaribbean small statesCentral African RepublicCentral Europe and the BalticsChadChileChinaColombiaComorosCongo, Dem. Rep.Congo, Rep.Costa RicaCote d'IvoireCroatiaCubaCuracaoCyprusCzech RepublicDenmarkDjiboutiDominicaDominican RepublicEarly-demographic dividendEast Asia & PacificEast Asia & Pacific (excluding high income)East Asia & Pacific (IDA & IBRD countries)EcuadorEgypt, Arab Rep.El SalvadorEquatorial GuineaEritreaEstoniaEthiopiaEuro areaEurope & Central AsiaEurope & Central Asia (excluding high income)Europe & Central Asia (IDA & IBRD countries)European UnionFijiFinlandFragile and conflict affected situationsFranceGabonGambia, TheGeorgiaGermanyGhanaGreeceGrenadaGuatemalaGuineaGuinea-BissauGuyanaHaitiHeavily indebted poor countries (HIPC)High incomeHondurasHong Kong SAR, ChinaHungaryIBRD onlyIcelandIDA & IBRD totalIDA blendIDA onlyIDA totalIndiaIndonesiaIran, Islamic Rep.IraqIrelandIsraelItalyJamaicaJapanJordanKazakhstanKenyaKiribatiKorea, Dem. People’s Rep.Korea, Rep.KuwaitKyrgyz RepublicLao PDRLate-demographic dividendLatin America & Caribbean Latin America & Caribbean (excluding high income)Latin America & the Caribbean (IDA & IBRD countries)LatviaLeast developed countries: UN classificationLebanonLesothoLiberiaLibyaLiechtensteinLithuaniaLow & middle incomeLow incomeLower middle incomeLuxembourgMacao SAR, ChinaMacedonia, FYRMadagascarMalawiMalaysiaMaldivesMaliMaltaMarshall IslandsMauritaniaMauritiusMexicoMicronesia, Fed. Sts.Middle East & North AfricaMiddle East & North Africa (excluding high income)Middle East & North Africa (IDA & IBRD countries)Middle incomeMoldovaMongoliaMontenegroMoroccoMozambiqueMyanmarNamibiaNauruNepalNetherlandsNew ZealandNicaraguaNigerNigeriaNorth AmericaNorwayOECD membersOmanOther small statesPacific island small statesPakistanPalauPanamaPapua New GuineaParaguayPeruPhilippinesPolandPortugalPost-demographic dividendPre-demographic dividendPuerto RicoQatarRomaniaRussian FederationRwandaSamoaSan MarinoSao Tome and PrincipeSaudi ArabiaSenegalSerbiaSeychellesSierra LeoneSlovak RepublicSloveniaSmall statesSolomon IslandsSomaliaSouth AfricaSouth AsiaSouth Asia (IDA & IBRD)South SudanSpainSri LankaSt. Kitts and NevisSt. LuciaSt. Vincent and the GrenadinesSub-Saharan Africa Sub-Saharan Africa (excluding high income)Sub-Saharan Africa (IDA & IBRD countries)SudanSurinameSwazilandSwedenSwitzerlandSyrian Arab RepublicTajikistanTanzaniaThailandTimor-LesteTogoTongaTrinidad and TobagoTunisiaTurkeyTurkmenistanTuvaluUgandaUkraineUnited Arab EmiratesUnited KingdomUnited StatesUpper middle incomeUruguayUzbekistanVanuatuVenezuela, RBVietnamWest Bank and GazaWorldYemen, Rep.ZambiaZimbabwe Timeline:
This timeline shows a graph from 1972 to 2013 of Iceland. No data until 1971. Number of actual observations by date: 42.
Source name:
World Development Indicators
Source organization:
UNESCO Institute for Statistics
Categories, topics:
Education
Last updated:
apr 23, 2017
Indicators value changes by year
Minimum:
97.472
jan 1, 1995
Maximum:
102.535
jan 1, 2002
At the date of observation
Value
Absolute change
Change from previous value
jan 1, 1972
98.168
+98.168
0.0%
jan 1, 1973
98.936
+0.768
0.78%
jan 1, 1974
98.791
-0.145
-0.15%
jan 1, 1975
98.954
+0.162
0.16%
jan 1, 1976
99.789
+0.835
0.84%
jan 1, 1977
99.672
-0.117
-0.12%
jan 1, 1978
99.819
+0.147
0.15%
jan 1, 1979
98.565
-1.254
-1.26%
jan 1, 1980
98.069
-0.496
-0.5%
jan 1, 1981
98.443
+0.374
0.38%
jan 1, 1982
99.126
+0.683
0.69%
jan 1, 1983
99.042
-0.085
-0.09%
jan 1, 1984
99.463
+0.421
0.43%
jan 1, 1985
100.278
+0.814
0.82%
jan 1, 1986
99.366
-0.912
-0.91%
jan 1, 1987
97.72
-1.645
-1.66%
jan 1, 1988
97.747
+0.027
0.03%
jan 1, 1989
100.044
+2.296
2.35%
jan 1, 1990
101.247
+1.203
1.2%
jan 1, 1991
101.527
+0.281
0.28%
jan 1, 1992
101.26
-0.267
-0.26%
jan 1, 1993
100.226
-1.033
-1.02%
jan 1, 1994
98.922
-1.305
-1.3%
jan 1, 1995
97.472
-1.449
-1.46%
jan 1, 1996
97.973
+0.5
0.51%
jan 1, 1997
98.103
+0.131
0.13%
jan 1, 1998
98.348
+0.244
0.25%
jan 1, 1999
99.036
+0.689
0.7%
jan 1, 2000
100.301
+1.264
1.28%
jan 1, 2001
102.192
+1.891
1.89%
jan 1, 2002
102.535
+0.343
0.34%
jan 1, 2003
100.105
-2.43
-2.37%
jan 1, 2004
99.397
-0.708
-0.71%
jan 1, 2005
97.896
-1.501
-1.51%
jan 1, 2006
97.932
+0.037
0.04%
jan 1, 2007
97.946
+0.014
0.01%
jan 1, 2008
98.041
+0.096
0.1%
jan 1, 2009
98.643
+0.601
0.61%
jan 1, 2010
99.127
+0.484
0.49%
jan 1, 2011
98.688
-0.439
-0.44%
jan 1, 2012
98.547
-0.141
-0.14%
jan 1, 2013
98.667
+0.12
0.12%
Ranking of countries by current statistics by years


Comments: