29
/
en
AIzaSyAYiBZKx7MnpbEhh9jyipgxe19OcubqV5w
April 1, 2024
87281
Bolivia
BOL
true
2
1
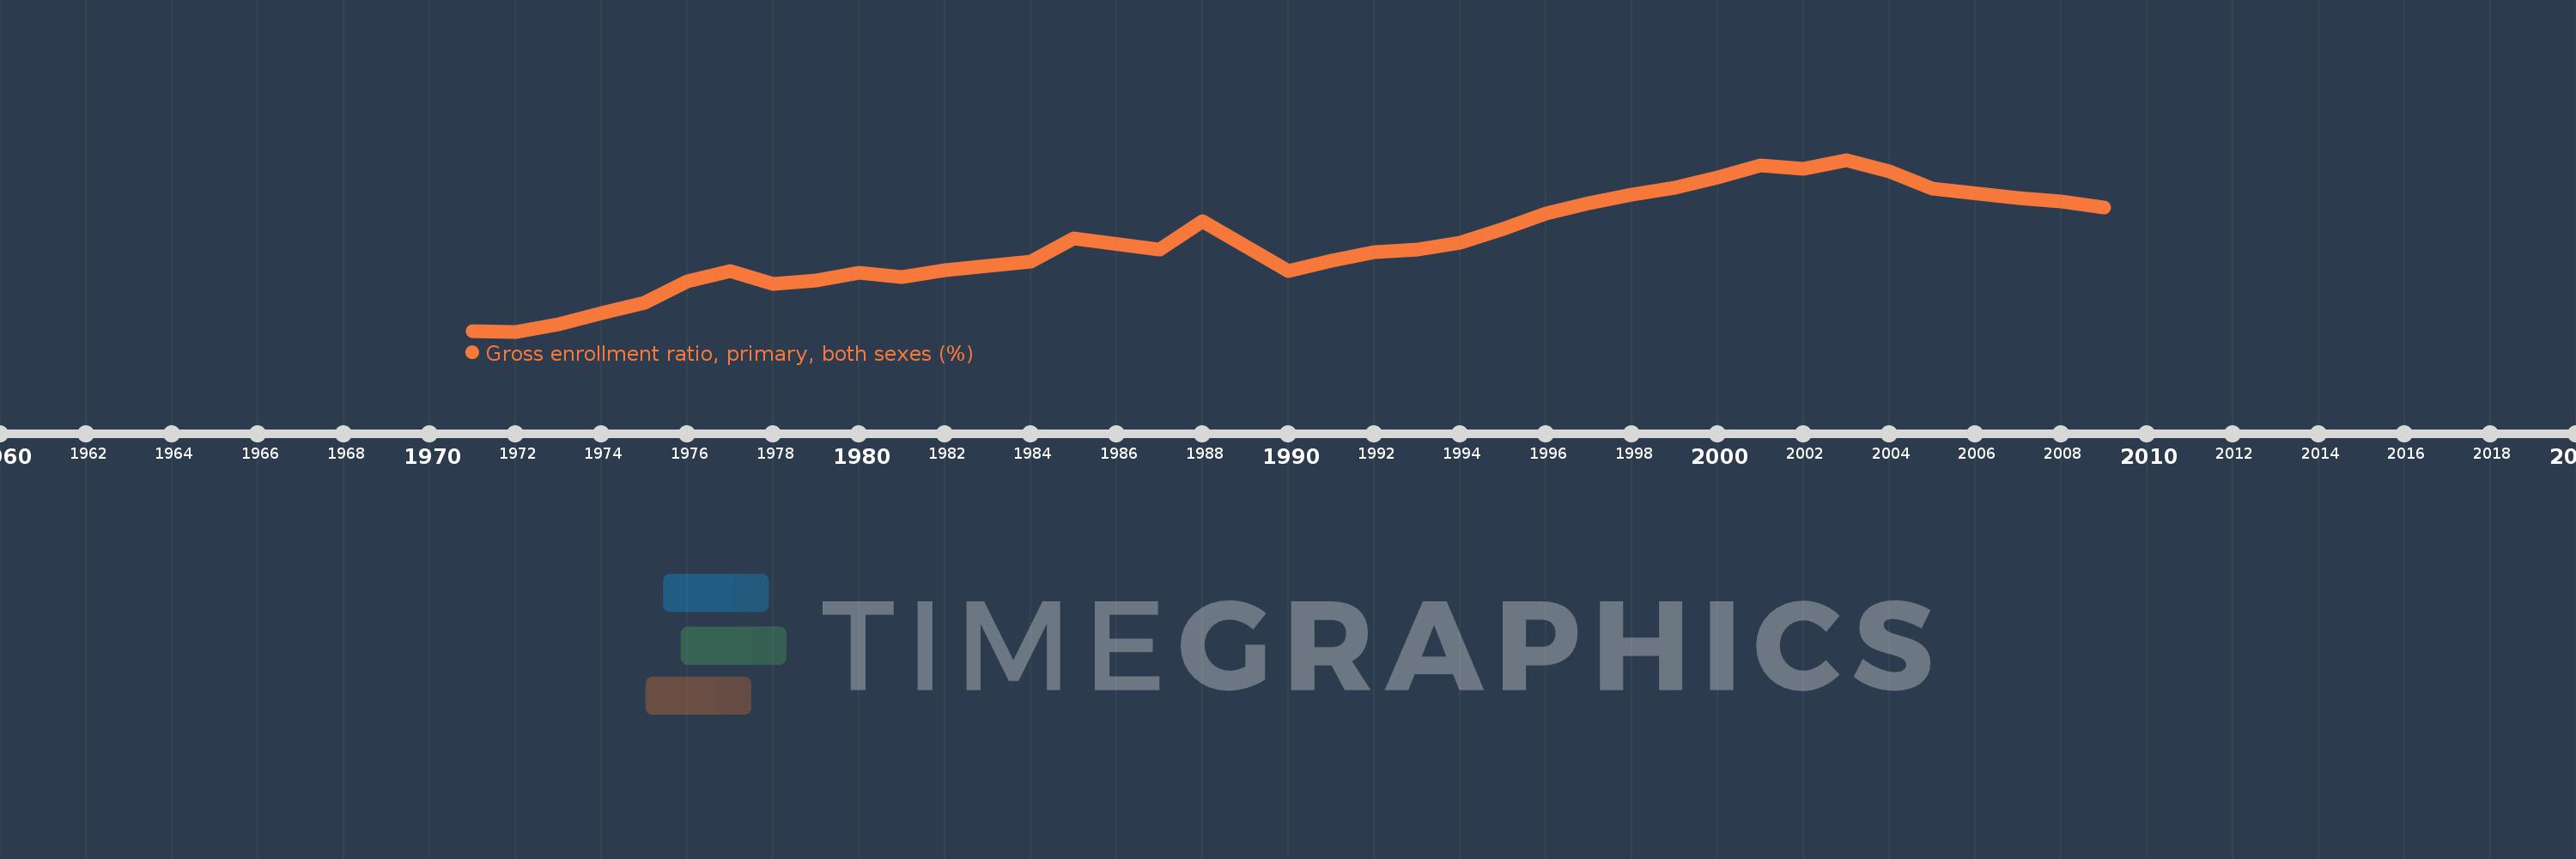
Gross enrollment ratio, primary, both sexes (%)
2009,2008,2007,2005,2004,2003,2002,2001,2000,1999,1998,1997,1996,1995,1994,1993,1992,1991,1990,1988,1987,1985,1984,1982,1981,1980,1979,1978,1977,1976,1975,1974,1973,1972,1971
This statistics in other country:
AfghanistanAlbaniaAlgeriaAndorraAngolaAntigua and BarbudaArab WorldArgentinaArmeniaArubaAustraliaAustriaAzerbaijanBahamas, TheBahrainBangladeshBarbadosBelarusBelgiumBelizeBeninBermudaBhutanBoliviaBosnia and HerzegovinaBotswanaBrazilBritish Virgin IslandsBrunei DarussalamBulgariaBurkina FasoBurundiCabo VerdeCambodiaCameroonCanadaCaribbean small statesCentral African RepublicCentral Europe and the BalticsChadChileChinaColombiaComorosCongo, Dem. Rep.Congo, Rep.Costa RicaCote d'IvoireCroatiaCubaCuracaoCyprusCzech RepublicDenmarkDjiboutiDominicaDominican RepublicEarly-demographic dividendEast Asia & PacificEast Asia & Pacific (excluding high income)East Asia & Pacific (IDA & IBRD countries)EcuadorEgypt, Arab Rep.El SalvadorEquatorial GuineaEritreaEstoniaEthiopiaEuro areaEurope & Central AsiaEurope & Central Asia (excluding high income)Europe & Central Asia (IDA & IBRD countries)European UnionFijiFinlandFragile and conflict affected situationsFranceGabonGambia, TheGeorgiaGermanyGhanaGreeceGrenadaGuatemalaGuineaGuinea-BissauGuyanaHaitiHeavily indebted poor countries (HIPC)High incomeHondurasHong Kong SAR, ChinaHungaryIBRD onlyIcelandIDA & IBRD totalIDA blendIDA onlyIDA totalIndiaIndonesiaIran, Islamic Rep.IraqIrelandIsraelItalyJamaicaJapanJordanKazakhstanKenyaKiribatiKorea, Dem. People’s Rep.Korea, Rep.KuwaitKyrgyz RepublicLao PDRLate-demographic dividendLatin America & Caribbean Latin America & Caribbean (excluding high income)Latin America & the Caribbean (IDA & IBRD countries)LatviaLeast developed countries: UN classificationLebanonLesothoLiberiaLibyaLiechtensteinLithuaniaLow & middle incomeLow incomeLower middle incomeLuxembourgMacao SAR, ChinaMacedonia, FYRMadagascarMalawiMalaysiaMaldivesMaliMaltaMarshall IslandsMauritaniaMauritiusMexicoMicronesia, Fed. Sts.Middle East & North AfricaMiddle East & North Africa (excluding high income)Middle East & North Africa (IDA & IBRD countries)Middle incomeMoldovaMongoliaMontenegroMoroccoMozambiqueMyanmarNamibiaNauruNepalNetherlandsNew ZealandNicaraguaNigerNigeriaNorth AmericaNorwayOECD membersOmanOther small statesPacific island small statesPakistanPalauPanamaPapua New GuineaParaguayPeruPhilippinesPolandPortugalPost-demographic dividendPre-demographic dividendPuerto RicoQatarRomaniaRussian FederationRwandaSamoaSan MarinoSao Tome and PrincipeSaudi ArabiaSenegalSerbiaSeychellesSierra LeoneSlovak RepublicSloveniaSmall statesSolomon IslandsSomaliaSouth AfricaSouth AsiaSouth Asia (IDA & IBRD)South SudanSpainSri LankaSt. Kitts and NevisSt. LuciaSt. Vincent and the GrenadinesSub-Saharan Africa Sub-Saharan Africa (excluding high income)Sub-Saharan Africa (IDA & IBRD countries)SudanSurinameSwazilandSwedenSwitzerlandSyrian Arab RepublicTajikistanTanzaniaThailandTimor-LesteTogoTongaTrinidad and TobagoTunisiaTurkeyTurkmenistanTuvaluUgandaUkraineUnited Arab EmiratesUnited KingdomUnited StatesUpper middle incomeUruguayUzbekistanVanuatuVenezuela, RBVietnamWest Bank and GazaWorldYemen, Rep.ZambiaZimbabwe Timeline:
This timeline shows a graph from 1971 to 2009 of Bolivia. No data until 1970. Number of actual observations by date: 35.
Source name:
World Development Indicators
Source organization:
UNESCO Institute for Statistics
Categories, topics:
Education
Last updated:
apr 23, 2017
Indicators value changes by year
Minimum:
84.886
jan 1, 1972
Maximum:
121.627
jan 1, 2003
At the date of observation
Value
Absolute change
Change from previous value
jan 1, 1971
85.021
+85.021
0.0%
jan 1, 1972
84.886
-0.135
-0.16%
jan 1, 1973
86.427
+1.541
1.82%
jan 1, 1974
88.863
+2.436
2.82%
jan 1, 1975
91.049
+2.186
2.46%
jan 1, 1976
95.706
+4.657
5.12%
jan 1, 1977
97.898
+2.191
2.29%
jan 1, 1978
94.997
-2.9
-2.96%
jan 1, 1979
95.904
+0.906
0.95%
jan 1, 1980
97.434
+1.53
1.6%
jan 1, 1981
96.575
-0.859
-0.88%
jan 1, 1982
98.068
+1.493
1.55%
jan 1, 1984
99.778
+1.71
1.74%
jan 1, 1985
104.864
+5.086
5.1%
jan 1, 1987
102.385
-2.479
-2.36%
jan 1, 1988
108.463
+6.078
5.94%
jan 1, 1990
97.813
-10.65
-9.82%
jan 1, 1991
100.132
+2.319
2.37%
jan 1, 1992
101.916
+1.784
1.78%
jan 1, 1993
102.461
+0.545
0.54%
jan 1, 1994
103.971
+1.51
1.47%
jan 1, 1995
106.783
+2.812
2.7%
jan 1, 1996
110.172
+3.389
3.17%
jan 1, 1997
112.304
+2.132
1.94%
jan 1, 1998
114.225
+1.922
1.71%
jan 1, 1999
115.687
+1.462
1.28%
jan 1, 2000
117.916
+2.229
1.93%
jan 1, 2001
120.399
+2.483
2.11%
jan 1, 2002
119.716
-0.683
-0.57%
jan 1, 2003
121.627
+1.911
1.6%
jan 1, 2004
119.105
-2.522
-2.07%
jan 1, 2005
115.544
-3.561
-2.99%
jan 1, 2007
113.414
-2.13
-1.84%
jan 1, 2008
112.647
-0.767
-0.68%
jan 1, 2009
111.519
-1.128
-1.0%
Ranking of countries by current statistics by years


Comments: