29
/
en
AIzaSyAYiBZKx7MnpbEhh9jyipgxe19OcubqV5w
April 1, 2024
164892
Jordan
JOR
true
2
1
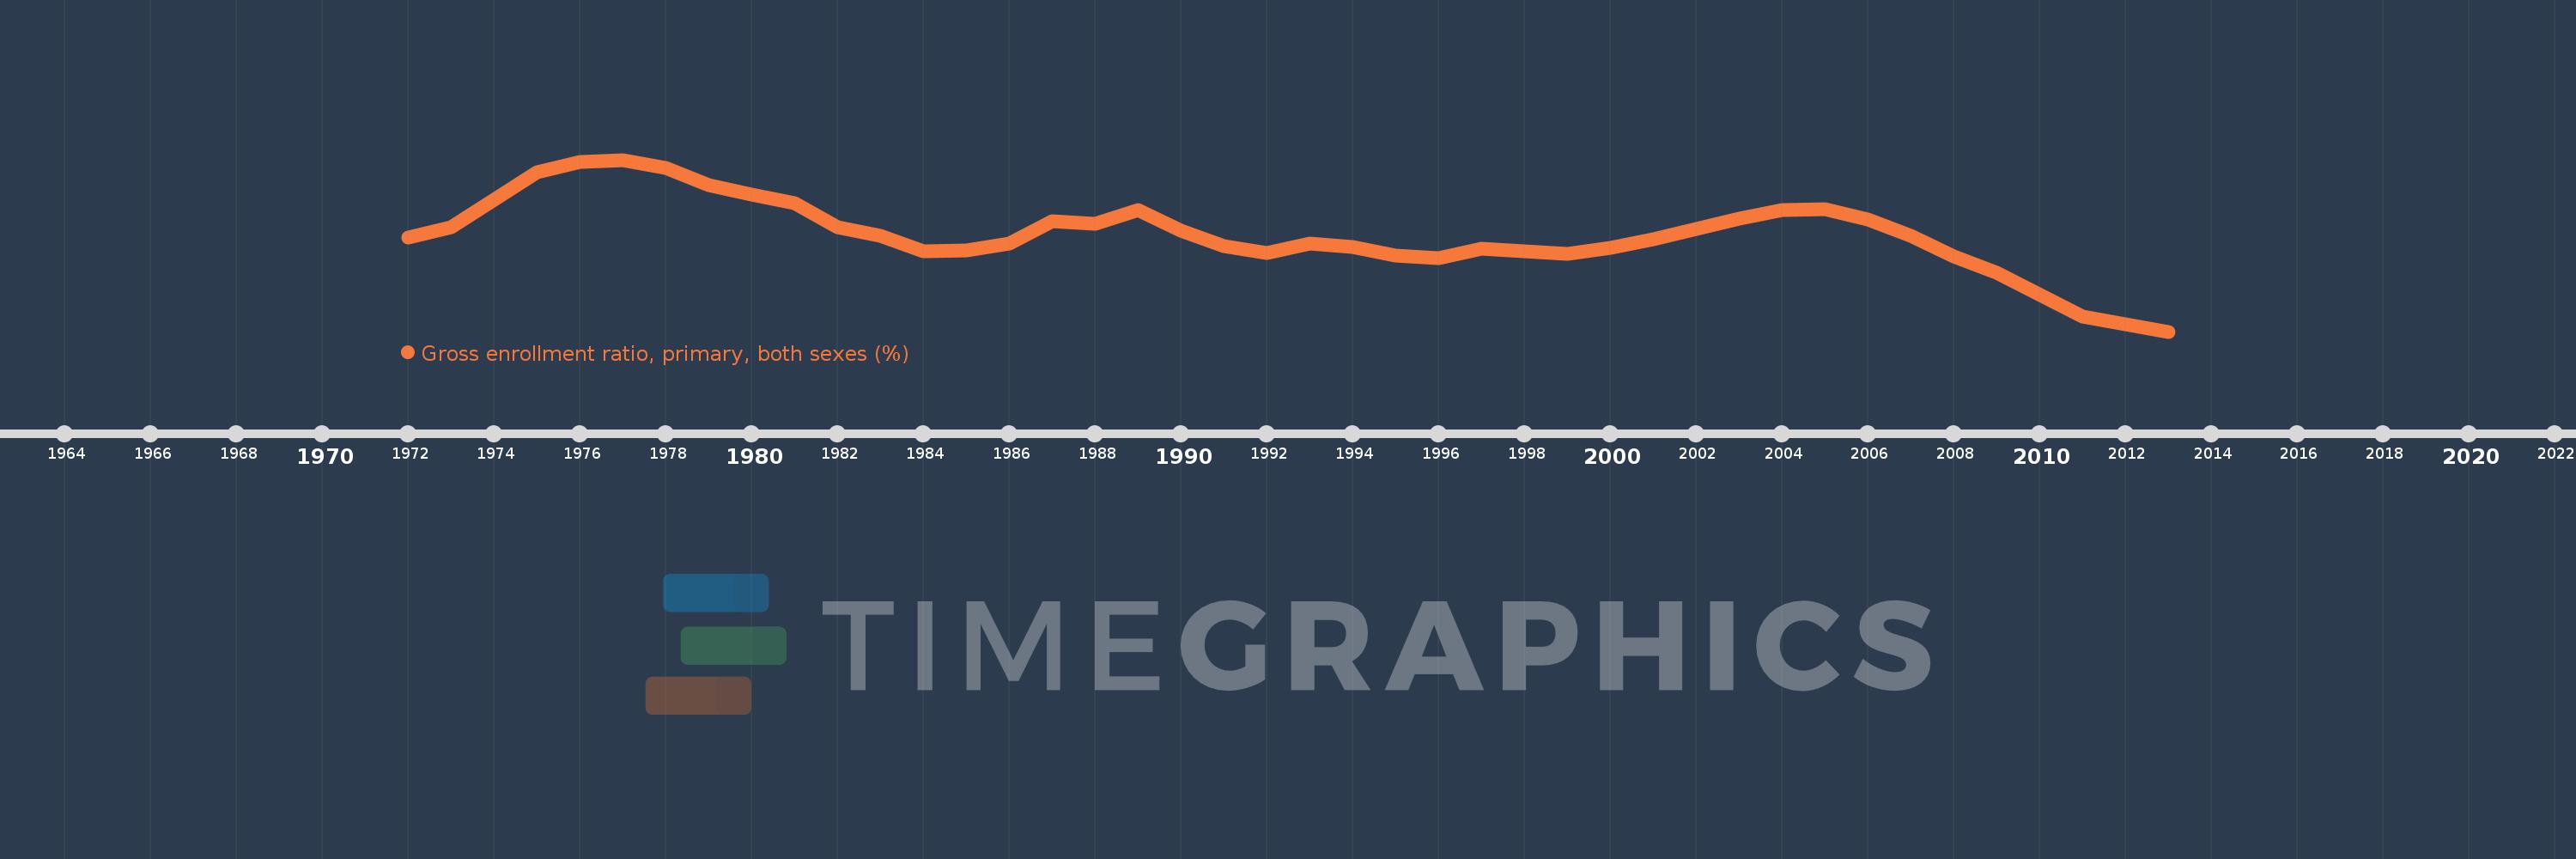
Gross enrollment ratio, primary, both sexes (%)
2013,2012,2011,2009,2008,2007,2006,2005,2004,2003,2001,2000,1999,1997,1996,1995,1994,1993,1992,1991,1990,1989,1988,1987,1986,1985,1984,1983,1982,1981,1980,1979,1978,1977,1976,1975,1974,1973,1972
This statistics in other country:
AfghanistanAlbaniaAlgeriaAndorraAngolaAntigua and BarbudaArab WorldArgentinaArmeniaArubaAustraliaAustriaAzerbaijanBahamas, TheBahrainBangladeshBarbadosBelarusBelgiumBelizeBeninBermudaBhutanBoliviaBosnia and HerzegovinaBotswanaBrazilBritish Virgin IslandsBrunei DarussalamBulgariaBurkina FasoBurundiCabo VerdeCambodiaCameroonCanadaCaribbean small statesCentral African RepublicCentral Europe and the BalticsChadChileChinaColombiaComorosCongo, Dem. Rep.Congo, Rep.Costa RicaCote d'IvoireCroatiaCubaCuracaoCyprusCzech RepublicDenmarkDjiboutiDominicaDominican RepublicEarly-demographic dividendEast Asia & PacificEast Asia & Pacific (excluding high income)East Asia & Pacific (IDA & IBRD countries)EcuadorEgypt, Arab Rep.El SalvadorEquatorial GuineaEritreaEstoniaEthiopiaEuro areaEurope & Central AsiaEurope & Central Asia (excluding high income)Europe & Central Asia (IDA & IBRD countries)European UnionFijiFinlandFragile and conflict affected situationsFranceGabonGambia, TheGeorgiaGermanyGhanaGreeceGrenadaGuatemalaGuineaGuinea-BissauGuyanaHaitiHeavily indebted poor countries (HIPC)High incomeHondurasHong Kong SAR, ChinaHungaryIBRD onlyIcelandIDA & IBRD totalIDA blendIDA onlyIDA totalIndiaIndonesiaIran, Islamic Rep.IraqIrelandIsraelItalyJamaicaJapanJordanKazakhstanKenyaKiribatiKorea, Dem. People’s Rep.Korea, Rep.KuwaitKyrgyz RepublicLao PDRLate-demographic dividendLatin America & Caribbean Latin America & Caribbean (excluding high income)Latin America & the Caribbean (IDA & IBRD countries)LatviaLeast developed countries: UN classificationLebanonLesothoLiberiaLibyaLiechtensteinLithuaniaLow & middle incomeLow incomeLower middle incomeLuxembourgMacao SAR, ChinaMacedonia, FYRMadagascarMalawiMalaysiaMaldivesMaliMaltaMarshall IslandsMauritaniaMauritiusMexicoMicronesia, Fed. Sts.Middle East & North AfricaMiddle East & North Africa (excluding high income)Middle East & North Africa (IDA & IBRD countries)Middle incomeMoldovaMongoliaMontenegroMoroccoMozambiqueMyanmarNamibiaNauruNepalNetherlandsNew ZealandNicaraguaNigerNigeriaNorth AmericaNorwayOECD membersOmanOther small statesPacific island small statesPakistanPalauPanamaPapua New GuineaParaguayPeruPhilippinesPolandPortugalPost-demographic dividendPre-demographic dividendPuerto RicoQatarRomaniaRussian FederationRwandaSamoaSan MarinoSao Tome and PrincipeSaudi ArabiaSenegalSerbiaSeychellesSierra LeoneSlovak RepublicSloveniaSmall statesSolomon IslandsSomaliaSouth AfricaSouth AsiaSouth Asia (IDA & IBRD)South SudanSpainSri LankaSt. Kitts and NevisSt. LuciaSt. Vincent and the GrenadinesSub-Saharan Africa Sub-Saharan Africa (excluding high income)Sub-Saharan Africa (IDA & IBRD countries)SudanSurinameSwazilandSwedenSwitzerlandSyrian Arab RepublicTajikistanTanzaniaThailandTimor-LesteTogoTongaTrinidad and TobagoTunisiaTurkeyTurkmenistanTuvaluUgandaUkraineUnited Arab EmiratesUnited KingdomUnited StatesUpper middle incomeUruguayUzbekistanVanuatuVenezuela, RBVietnamWest Bank and GazaWorldYemen, Rep.ZambiaZimbabwe Timeline:
This timeline shows a graph from 1972 to 2013 of Jordan. No data until 1971. Number of actual observations by date: 39.
Source name:
World Development Indicators
Source organization:
UNESCO Institute for Statistics
Categories, topics:
Education
Last updated:
apr 23, 2017
Indicators value changes by year
Minimum:
88.719
jan 1, 2013
Maximum:
114.527
jan 1, 1977
At the date of observation
Value
Absolute change
Change from previous value
jan 1, 1972
102.795
+102.795
0.0%
jan 1, 1973
104.446
+1.651
1.61%
jan 1, 1974
108.57
+4.124
3.95%
jan 1, 1975
112.611
+4.041
3.72%
jan 1, 1976
114.244
+1.633
1.45%
jan 1, 1977
114.527
+0.283
0.25%
jan 1, 1978
113.285
-1.242
-1.08%
jan 1, 1979
110.721
-2.564
-2.26%
jan 1, 1980
109.299
-1.422
-1.28%
jan 1, 1981
108.025
-1.274
-1.17%
jan 1, 1982
104.388
-3.638
-3.37%
jan 1, 1983
103.166
-1.221
-1.17%
jan 1, 1984
100.736
-2.431
-2.36%
jan 1, 1985
100.903
+0.167
0.17%
jan 1, 1986
101.893
+0.991
0.98%
jan 1, 1987
105.303
+3.41
3.35%
jan 1, 1988
104.857
-0.445
-0.42%
jan 1, 1989
106.983
+2.126
2.03%
jan 1, 1990
103.85
-3.134
-2.93%
jan 1, 1991
101.578
-2.272
-2.19%
jan 1, 1992
100.564
-1.014
-1.0%
jan 1, 1993
101.935
+1.371
1.36%
jan 1, 1994
101.473
-0.462
-0.45%
jan 1, 1995
100.152
-1.321
-1.3%
jan 1, 1996
99.78
-0.371
-0.37%
jan 1, 1997
101.114
+1.333
1.34%
jan 1, 1999
100.337
-0.777
-0.77%
jan 1, 2000
101.312
+0.975
0.97%
jan 1, 2001
102.529
+1.217
1.2%
jan 1, 2003
105.703
+3.174
3.1%
jan 1, 2004
107.012
+1.31
1.24%
jan 1, 2005
107.084
+0.071
0.07%
jan 1, 2006
105.55
-1.534
-1.43%
jan 1, 2007
103.116
-2.434
-2.31%
jan 1, 2008
100.005
-3.112
-3.02%
jan 1, 2009
97.538
-2.466
-2.47%
jan 1, 2011
91.011
-6.528
-6.69%
jan 1, 2012
89.788
-1.223
-1.34%
jan 1, 2013
88.719
-1.069
-1.19%
Ranking of countries by current statistics by years


Comments: