29
/
en
AIzaSyAYiBZKx7MnpbEhh9jyipgxe19OcubqV5w
April 1, 2024
233662
Sao Tome and Principe
STP
true
2
1
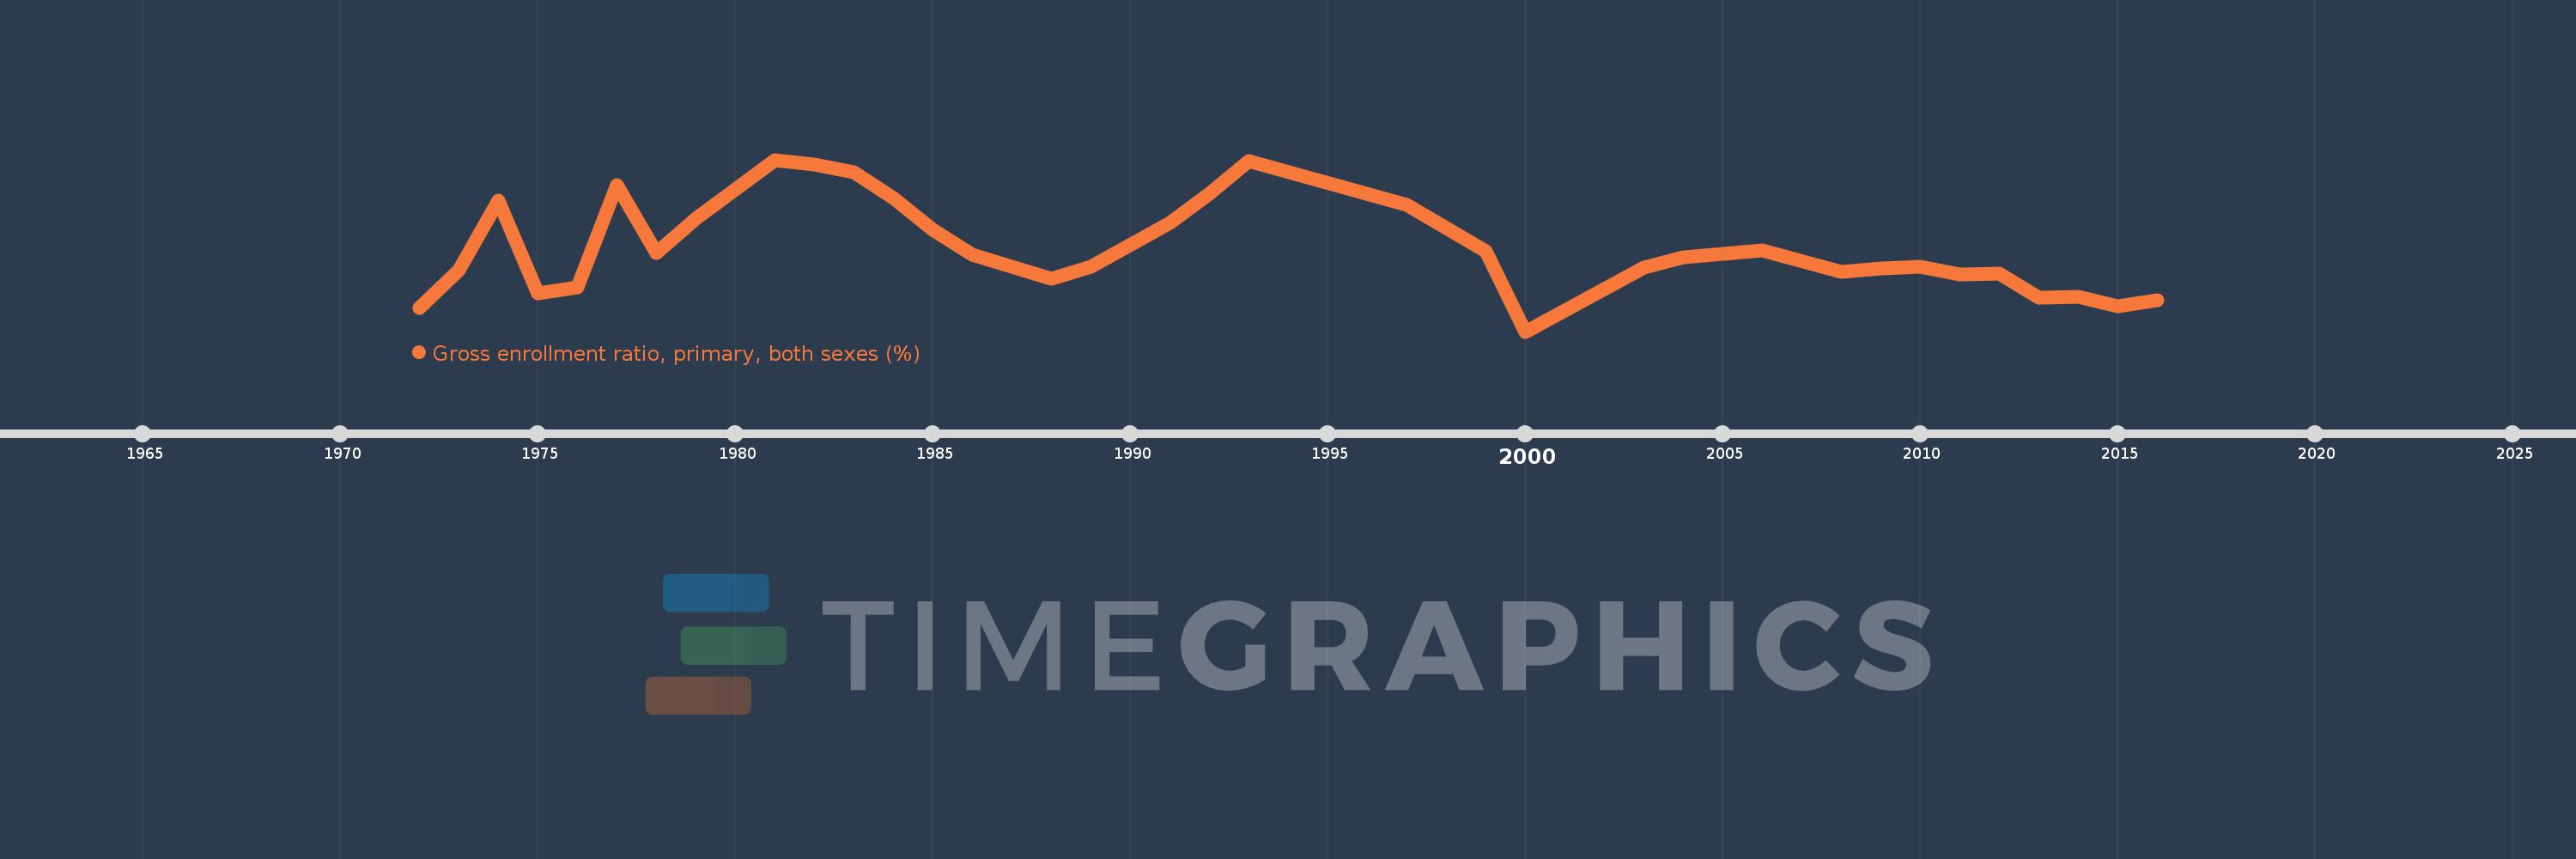
Gross enrollment ratio, primary, both sexes (%)
2016,2015,2014,2013,2012,2011,2010,2009,2008,2006,2005,2004,2003,2000,1999,1997,1993,1992,1991,1989,1988,1986,1985,1984,1983,1982,1981,1979,1978,1977,1976,1975,1974,1973,1972
This statistics in other country:
AfghanistanAlbaniaAlgeriaAndorraAngolaAntigua and BarbudaArab WorldArgentinaArmeniaArubaAustraliaAustriaAzerbaijanBahamas, TheBahrainBangladeshBarbadosBelarusBelgiumBelizeBeninBermudaBhutanBoliviaBosnia and HerzegovinaBotswanaBrazilBritish Virgin IslandsBrunei DarussalamBulgariaBurkina FasoBurundiCabo VerdeCambodiaCameroonCanadaCaribbean small statesCentral African RepublicCentral Europe and the BalticsChadChileChinaColombiaComorosCongo, Dem. Rep.Congo, Rep.Costa RicaCote d'IvoireCroatiaCubaCuracaoCyprusCzech RepublicDenmarkDjiboutiDominicaDominican RepublicEarly-demographic dividendEast Asia & PacificEast Asia & Pacific (excluding high income)East Asia & Pacific (IDA & IBRD countries)EcuadorEgypt, Arab Rep.El SalvadorEquatorial GuineaEritreaEstoniaEthiopiaEuro areaEurope & Central AsiaEurope & Central Asia (excluding high income)Europe & Central Asia (IDA & IBRD countries)European UnionFijiFinlandFragile and conflict affected situationsFranceGabonGambia, TheGeorgiaGermanyGhanaGreeceGrenadaGuatemalaGuineaGuinea-BissauGuyanaHaitiHeavily indebted poor countries (HIPC)High incomeHondurasHong Kong SAR, ChinaHungaryIBRD onlyIcelandIDA & IBRD totalIDA blendIDA onlyIDA totalIndiaIndonesiaIran, Islamic Rep.IraqIrelandIsraelItalyJamaicaJapanJordanKazakhstanKenyaKiribatiKorea, Dem. People’s Rep.Korea, Rep.KuwaitKyrgyz RepublicLao PDRLate-demographic dividendLatin America & Caribbean Latin America & Caribbean (excluding high income)Latin America & the Caribbean (IDA & IBRD countries)LatviaLeast developed countries: UN classificationLebanonLesothoLiberiaLibyaLiechtensteinLithuaniaLow & middle incomeLow incomeLower middle incomeLuxembourgMacao SAR, ChinaMacedonia, FYRMadagascarMalawiMalaysiaMaldivesMaliMaltaMarshall IslandsMauritaniaMauritiusMexicoMicronesia, Fed. Sts.Middle East & North AfricaMiddle East & North Africa (excluding high income)Middle East & North Africa (IDA & IBRD countries)Middle incomeMoldovaMongoliaMontenegroMoroccoMozambiqueMyanmarNamibiaNauruNepalNetherlandsNew ZealandNicaraguaNigerNigeriaNorth AmericaNorwayOECD membersOmanOther small statesPacific island small statesPakistanPalauPanamaPapua New GuineaParaguayPeruPhilippinesPolandPortugalPost-demographic dividendPre-demographic dividendPuerto RicoQatarRomaniaRussian FederationRwandaSamoaSan MarinoSao Tome and PrincipeSaudi ArabiaSenegalSerbiaSeychellesSierra LeoneSlovak RepublicSloveniaSmall statesSolomon IslandsSomaliaSouth AfricaSouth AsiaSouth Asia (IDA & IBRD)South SudanSpainSri LankaSt. Kitts and NevisSt. LuciaSt. Vincent and the GrenadinesSub-Saharan Africa Sub-Saharan Africa (excluding high income)Sub-Saharan Africa (IDA & IBRD countries)SudanSurinameSwazilandSwedenSwitzerlandSyrian Arab RepublicTajikistanTanzaniaThailandTimor-LesteTogoTongaTrinidad and TobagoTunisiaTurkeyTurkmenistanTuvaluUgandaUkraineUnited Arab EmiratesUnited KingdomUnited StatesUpper middle incomeUruguayUzbekistanVanuatuVenezuela, RBVietnamWest Bank and GazaWorldYemen, Rep.ZambiaZimbabwe Timeline:
This timeline shows a graph from 1972 to 2016 of Sao Tome and Principe. No data until 1971. Number of actual observations by date: 35.
Source name:
World Development Indicators
Source organization:
UNESCO Institute for Statistics
Categories, topics:
Education
Last updated:
apr 23, 2017
Indicators value changes by year
Minimum:
103.352
jan 1, 2000
Maximum:
159.338
jan 1, 1981
At the date of observation
Value
Absolute change
Change from previous value
jan 1, 1972
111.1
+111.1
0.0%
jan 1, 1973
123.4
+12.3
11.07%
jan 1, 1974
146.0
+22.599
18.31%
jan 1, 1975
115.79
-30.209
-20.69%
jan 1, 1976
117.808
+2.018
1.74%
jan 1, 1977
151.009
+33.201
28.18%
jan 1, 1978
129.056
-21.953
-14.54%
jan 1, 1979
140.301
+11.245
8.71%
jan 1, 1981
159.338
+19.037
13.57%
jan 1, 1982
157.856
-1.482
-0.93%
jan 1, 1983
155.235
-2.621
-1.66%
jan 1, 1984
146.956
-8.279
-5.33%
jan 1, 1985
136.609
-10.347
-7.04%
jan 1, 1986
128.412
-8.197
-6.0%
jan 1, 1988
120.707
-7.705
-6.0%
jan 1, 1989
124.458
+3.752
3.11%
jan 1, 1991
138.761
+14.303
11.49%
jan 1, 1992
148.185
+9.424
6.79%
jan 1, 1993
158.811
+10.626
7.17%
jan 1, 1997
144.679
-14.133
-8.9%
jan 1, 1999
129.504
-15.175
-10.49%
jan 1, 2000
103.352
-26.151
-20.19%
jan 1, 2003
124.25
+20.897
20.22%
jan 1, 2004
127.446
+3.196
2.57%
jan 1, 2005
128.707
+1.261
0.99%
jan 1, 2006
129.75
+1.044
0.81%
jan 1, 2008
122.923
-6.827
-5.26%
jan 1, 2009
123.908
+0.985
0.8%
jan 1, 2010
124.623
+0.715
0.58%
jan 1, 2011
121.974
-2.649
-2.13%
jan 1, 2012
122.298
+0.325
0.27%
jan 1, 2013
114.391
-7.907
-6.47%
jan 1, 2014
114.577
+0.186
0.16%
jan 1, 2015
111.744
-2.834
-2.47%
jan 1, 2016
113.6
+1.857
1.66%
Ranking of countries by current statistics by years


Comments: