29
/
en
AIzaSyAYiBZKx7MnpbEhh9jyipgxe19OcubqV5w
April 1, 2024
269380
Turkey
TUR
true
2
1
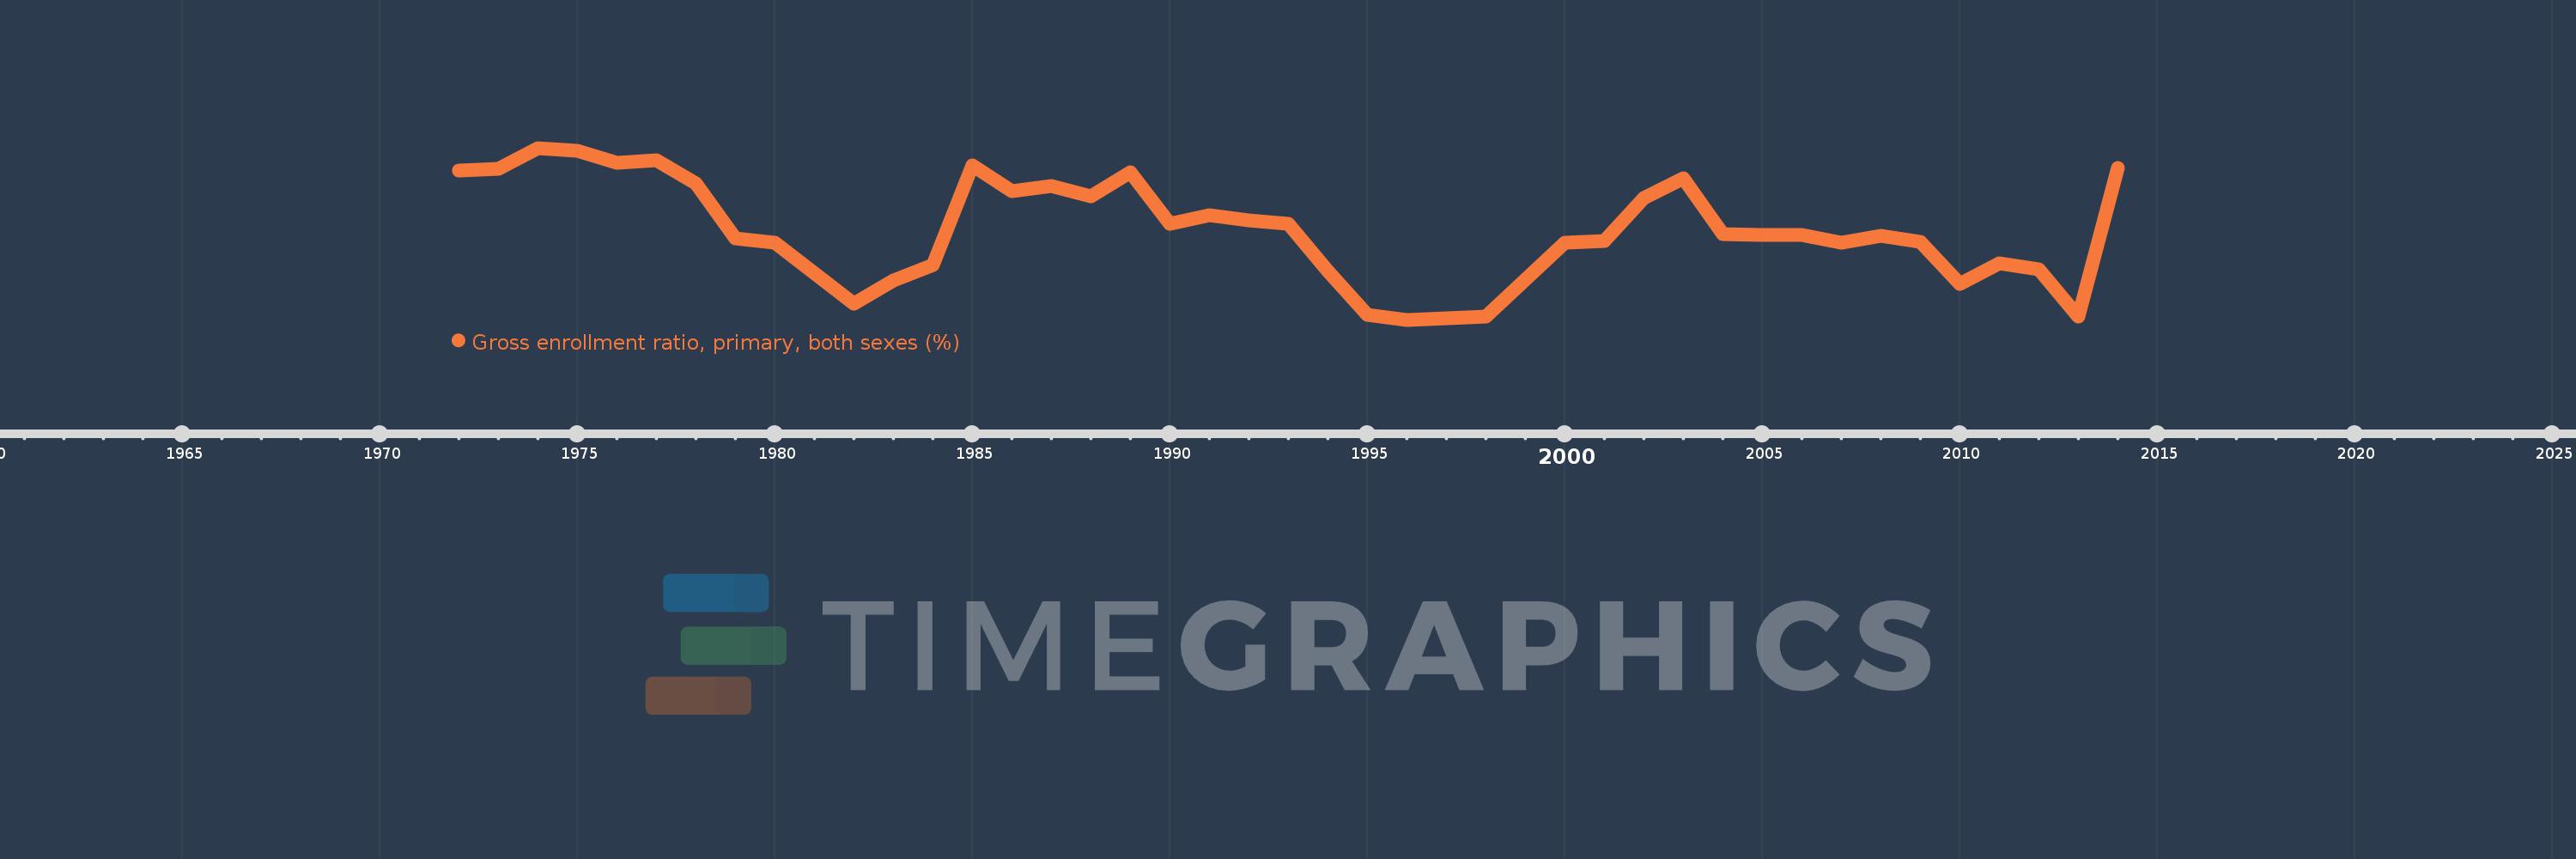
Gross enrollment ratio, primary, both sexes (%)
2014,2013,2012,2011,2010,2009,2008,2007,2006,2005,2004,2003,2002,2001,2000,1998,1996,1995,1994,1993,1992,1991,1990,1989,1988,1987,1986,1985,1984,1983,1982,1980,1979,1978,1977,1976,1975,1974,1973,1972
This statistics in other country:
AfghanistanAlbaniaAlgeriaAndorraAngolaAntigua and BarbudaArab WorldArgentinaArmeniaArubaAustraliaAustriaAzerbaijanBahamas, TheBahrainBangladeshBarbadosBelarusBelgiumBelizeBeninBermudaBhutanBoliviaBosnia and HerzegovinaBotswanaBrazilBritish Virgin IslandsBrunei DarussalamBulgariaBurkina FasoBurundiCabo VerdeCambodiaCameroonCanadaCaribbean small statesCentral African RepublicCentral Europe and the BalticsChadChileChinaColombiaComorosCongo, Dem. Rep.Congo, Rep.Costa RicaCote d'IvoireCroatiaCubaCuracaoCyprusCzech RepublicDenmarkDjiboutiDominicaDominican RepublicEarly-demographic dividendEast Asia & PacificEast Asia & Pacific (excluding high income)East Asia & Pacific (IDA & IBRD countries)EcuadorEgypt, Arab Rep.El SalvadorEquatorial GuineaEritreaEstoniaEthiopiaEuro areaEurope & Central AsiaEurope & Central Asia (excluding high income)Europe & Central Asia (IDA & IBRD countries)European UnionFijiFinlandFragile and conflict affected situationsFranceGabonGambia, TheGeorgiaGermanyGhanaGreeceGrenadaGuatemalaGuineaGuinea-BissauGuyanaHaitiHeavily indebted poor countries (HIPC)High incomeHondurasHong Kong SAR, ChinaHungaryIBRD onlyIcelandIDA & IBRD totalIDA blendIDA onlyIDA totalIndiaIndonesiaIran, Islamic Rep.IraqIrelandIsraelItalyJamaicaJapanJordanKazakhstanKenyaKiribatiKorea, Dem. People’s Rep.Korea, Rep.KuwaitKyrgyz RepublicLao PDRLate-demographic dividendLatin America & Caribbean Latin America & Caribbean (excluding high income)Latin America & the Caribbean (IDA & IBRD countries)LatviaLeast developed countries: UN classificationLebanonLesothoLiberiaLibyaLiechtensteinLithuaniaLow & middle incomeLow incomeLower middle incomeLuxembourgMacao SAR, ChinaMacedonia, FYRMadagascarMalawiMalaysiaMaldivesMaliMaltaMarshall IslandsMauritaniaMauritiusMexicoMicronesia, Fed. Sts.Middle East & North AfricaMiddle East & North Africa (excluding high income)Middle East & North Africa (IDA & IBRD countries)Middle incomeMoldovaMongoliaMontenegroMoroccoMozambiqueMyanmarNamibiaNauruNepalNetherlandsNew ZealandNicaraguaNigerNigeriaNorth AmericaNorwayOECD membersOmanOther small statesPacific island small statesPakistanPalauPanamaPapua New GuineaParaguayPeruPhilippinesPolandPortugalPost-demographic dividendPre-demographic dividendPuerto RicoQatarRomaniaRussian FederationRwandaSamoaSan MarinoSao Tome and PrincipeSaudi ArabiaSenegalSerbiaSeychellesSierra LeoneSlovak RepublicSloveniaSmall statesSolomon IslandsSomaliaSouth AfricaSouth AsiaSouth Asia (IDA & IBRD)South SudanSpainSri LankaSt. Kitts and NevisSt. LuciaSt. Vincent and the GrenadinesSub-Saharan Africa Sub-Saharan Africa (excluding high income)Sub-Saharan Africa (IDA & IBRD countries)SudanSurinameSwazilandSwedenSwitzerlandSyrian Arab RepublicTajikistanTanzaniaThailandTimor-LesteTogoTongaTrinidad and TobagoTunisiaTurkeyTurkmenistanTuvaluUgandaUkraineUnited Arab EmiratesUnited KingdomUnited StatesUpper middle incomeUruguayUzbekistanVanuatuVenezuela, RBVietnamWest Bank and GazaWorldYemen, Rep.ZambiaZimbabwe Timeline:
This timeline shows a graph from 1972 to 2014 of Turkey. No data until 1971. Number of actual observations by date: 40.
Source name:
World Development Indicators
Source organization:
UNESCO Institute for Statistics
Categories, topics:
Education
Last updated:
apr 23, 2017
Indicators value changes by year
Maximum:
107.983
jan 1, 1974
At the date of observation
Value
Absolute change
Change from previous value
jan 1, 1972
106.746
+106.746
0.0%
jan 1, 1973
106.837
+0.091
0.09%
jan 1, 1974
107.983
+1.146
1.07%
jan 1, 1975
107.813
-0.17
-0.16%
jan 1, 1976
107.159
-0.654
-0.61%
jan 1, 1977
107.281
+0.121
0.11%
jan 1, 1978
106.006
-1.275
-1.19%
jan 1, 1979
102.937
-3.069
-2.89%
jan 1, 1980
102.7
-0.237
-0.23%
jan 1, 1982
99.314
-3.386
-3.3%
jan 1, 1983
100.595
+1.28
1.29%
jan 1, 1984
101.444
+0.849
0.84%
jan 1, 1985
107.008
+5.564
5.49%
jan 1, 1986
105.569
-1.439
-1.34%
jan 1, 1987
105.866
+0.297
0.28%
jan 1, 1988
105.297
-0.569
-0.54%
jan 1, 1989
106.647
+1.35
1.28%
jan 1, 1990
103.776
-2.871
-2.69%
jan 1, 1991
104.214
+0.439
0.42%
jan 1, 1992
103.943
-0.271
-0.26%
jan 1, 1993
103.772
-0.172
-0.17%
jan 1, 1994
101.124
-2.648
-2.55%
jan 1, 1995
98.693
-2.431
-2.4%
jan 1, 1996
98.41
-0.283
-0.29%
jan 1, 1998
98.59
+0.18
0.18%
jan 1, 2000
102.68
+4.09
4.15%
jan 1, 2001
102.785
+0.105
0.1%
jan 1, 2002
105.19
+2.405
2.34%
jan 1, 2003
106.273
+1.084
1.03%
jan 1, 2004
103.172
-3.101
-2.92%
jan 1, 2005
103.152
-0.02
-0.02%
jan 1, 2006
103.157
+0.005
0.0%
jan 1, 2007
102.708
-0.449
-0.44%
jan 1, 2008
103.092
+0.384
0.37%
jan 1, 2009
102.765
-0.327
-0.32%
jan 1, 2010
100.409
-2.356
-2.29%
jan 1, 2011
101.552
+1.143
1.14%
jan 1, 2012
101.225
-0.326
-0.32%
jan 1, 2013
98.607
-2.619
-2.59%
jan 1, 2014
106.864
+8.257
8.37%
Ranking of countries by current statistics by years


Comments: