29
/
en
AIzaSyAYiBZKx7MnpbEhh9jyipgxe19OcubqV5w
April 1, 2024
207991
Netherlands
NLD
true
2
1
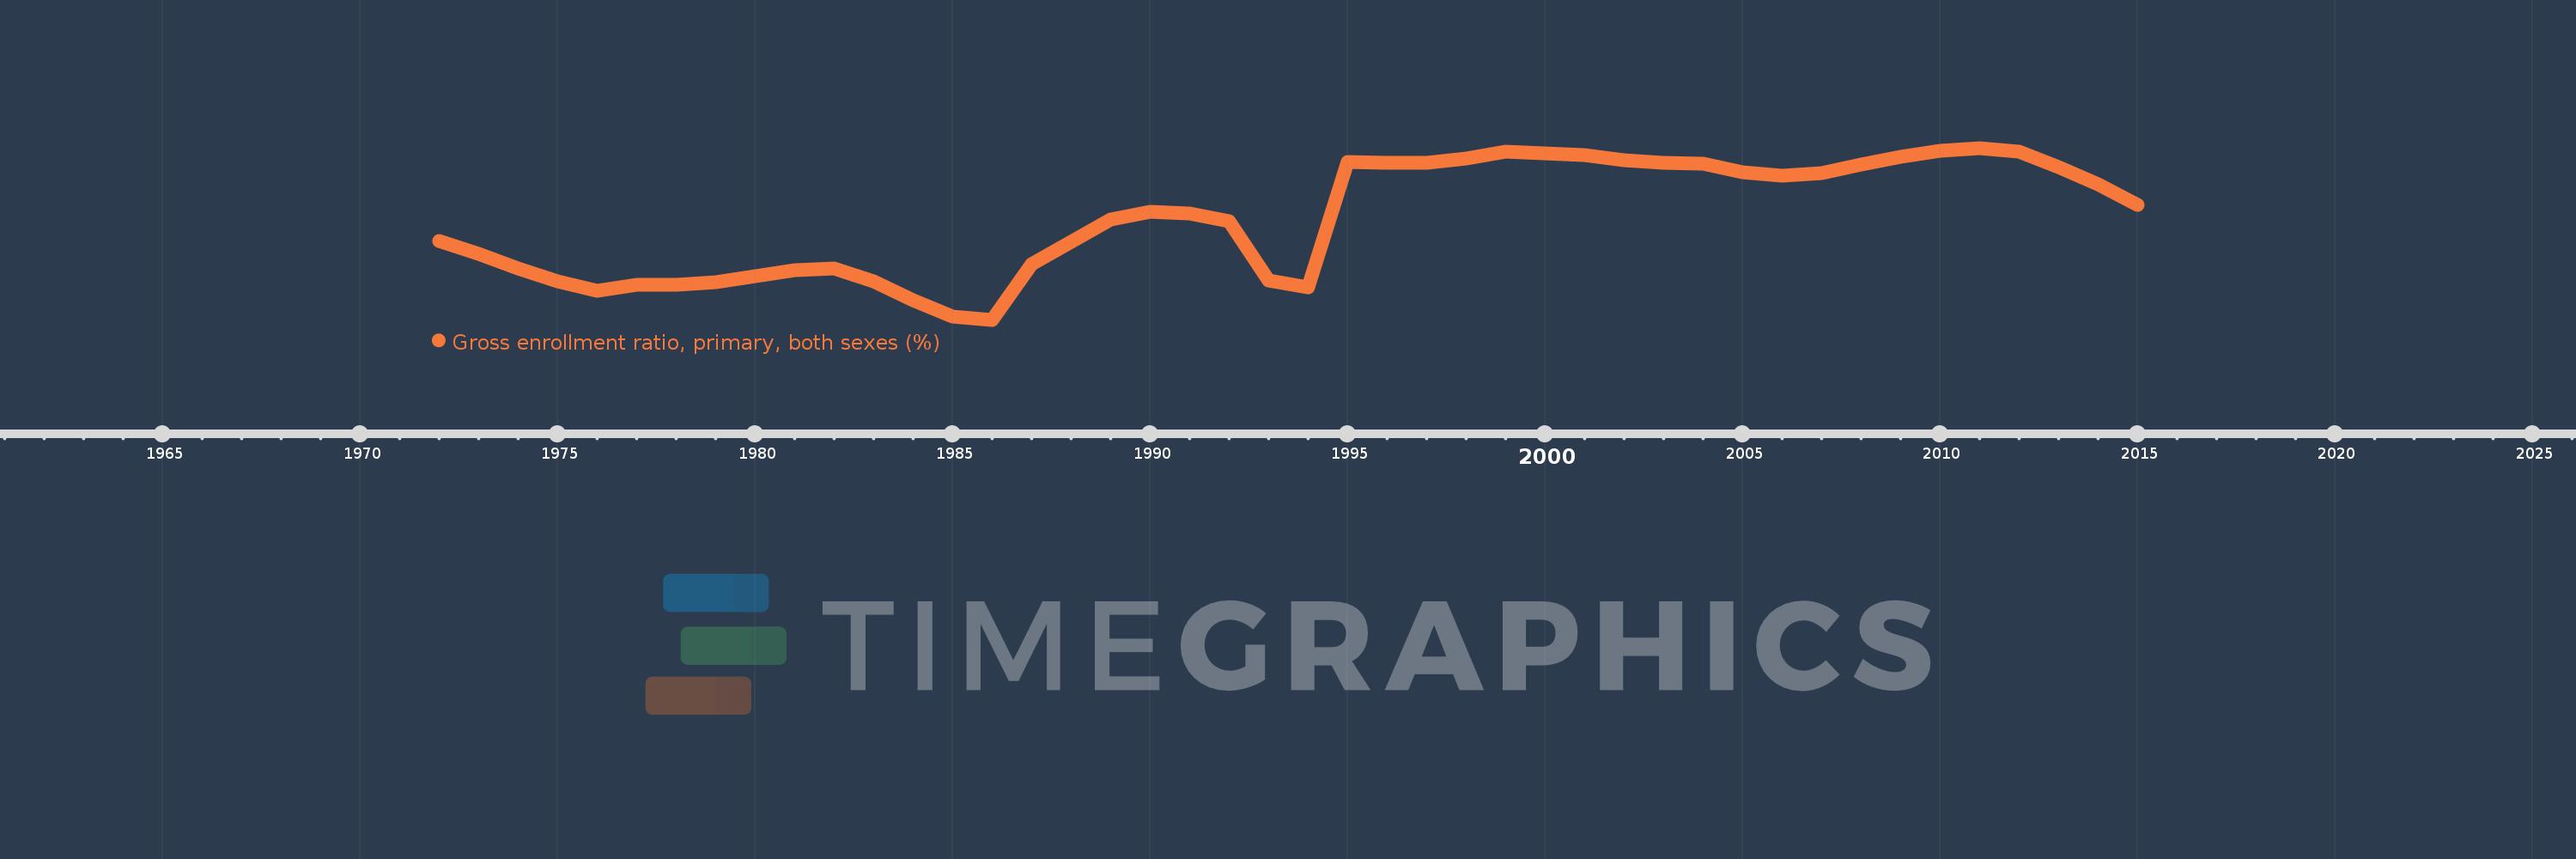
Gross enrollment ratio, primary, both sexes (%)
2015,2014,2013,2012,2011,2010,2009,2008,2007,2006,2005,2004,2003,2002,2001,2000,1999,1998,1997,1996,1995,1994,1993,1992,1991,1990,1989,1988,1987,1986,1985,1984,1983,1982,1981,1980,1979,1978,1977,1976,1975,1974,1973,1972
This statistics in other country:
AfghanistanAlbaniaAlgeriaAndorraAngolaAntigua and BarbudaArab WorldArgentinaArmeniaArubaAustraliaAustriaAzerbaijanBahamas, TheBahrainBangladeshBarbadosBelarusBelgiumBelizeBeninBermudaBhutanBoliviaBosnia and HerzegovinaBotswanaBrazilBritish Virgin IslandsBrunei DarussalamBulgariaBurkina FasoBurundiCabo VerdeCambodiaCameroonCanadaCaribbean small statesCentral African RepublicCentral Europe and the BalticsChadChileChinaColombiaComorosCongo, Dem. Rep.Congo, Rep.Costa RicaCote d'IvoireCroatiaCubaCuracaoCyprusCzech RepublicDenmarkDjiboutiDominicaDominican RepublicEarly-demographic dividendEast Asia & PacificEast Asia & Pacific (excluding high income)East Asia & Pacific (IDA & IBRD countries)EcuadorEgypt, Arab Rep.El SalvadorEquatorial GuineaEritreaEstoniaEthiopiaEuro areaEurope & Central AsiaEurope & Central Asia (excluding high income)Europe & Central Asia (IDA & IBRD countries)European UnionFijiFinlandFragile and conflict affected situationsFranceGabonGambia, TheGeorgiaGermanyGhanaGreeceGrenadaGuatemalaGuineaGuinea-BissauGuyanaHaitiHeavily indebted poor countries (HIPC)High incomeHondurasHong Kong SAR, ChinaHungaryIBRD onlyIcelandIDA & IBRD totalIDA blendIDA onlyIDA totalIndiaIndonesiaIran, Islamic Rep.IraqIrelandIsraelItalyJamaicaJapanJordanKazakhstanKenyaKiribatiKorea, Dem. People’s Rep.Korea, Rep.KuwaitKyrgyz RepublicLao PDRLate-demographic dividendLatin America & Caribbean Latin America & Caribbean (excluding high income)Latin America & the Caribbean (IDA & IBRD countries)LatviaLeast developed countries: UN classificationLebanonLesothoLiberiaLibyaLiechtensteinLithuaniaLow & middle incomeLow incomeLower middle incomeLuxembourgMacao SAR, ChinaMacedonia, FYRMadagascarMalawiMalaysiaMaldivesMaliMaltaMarshall IslandsMauritaniaMauritiusMexicoMicronesia, Fed. Sts.Middle East & North AfricaMiddle East & North Africa (excluding high income)Middle East & North Africa (IDA & IBRD countries)Middle incomeMoldovaMongoliaMontenegroMoroccoMozambiqueMyanmarNamibiaNauruNepalNetherlandsNew ZealandNicaraguaNigerNigeriaNorth AmericaNorwayOECD membersOmanOther small statesPacific island small statesPakistanPalauPanamaPapua New GuineaParaguayPeruPhilippinesPolandPortugalPost-demographic dividendPre-demographic dividendPuerto RicoQatarRomaniaRussian FederationRwandaSamoaSan MarinoSao Tome and PrincipeSaudi ArabiaSenegalSerbiaSeychellesSierra LeoneSlovak RepublicSloveniaSmall statesSolomon IslandsSomaliaSouth AfricaSouth AsiaSouth Asia (IDA & IBRD)South SudanSpainSri LankaSt. Kitts and NevisSt. LuciaSt. Vincent and the GrenadinesSub-Saharan Africa Sub-Saharan Africa (excluding high income)Sub-Saharan Africa (IDA & IBRD countries)SudanSurinameSwazilandSwedenSwitzerlandSyrian Arab RepublicTajikistanTanzaniaThailandTimor-LesteTogoTongaTrinidad and TobagoTunisiaTurkeyTurkmenistanTuvaluUgandaUkraineUnited Arab EmiratesUnited KingdomUnited StatesUpper middle incomeUruguayUzbekistanVanuatuVenezuela, RBVietnamWest Bank and GazaWorldYemen, Rep.ZambiaZimbabwe Timeline:
This timeline shows a graph from 1972 to 2015 of Netherlands. No data until 1971. Number of actual observations by date: 44.
Source name:
World Development Indicators
Source organization:
UNESCO Institute for Statistics
Categories, topics:
Education
Last updated:
apr 23, 2017
Indicators value changes by year
Minimum:
94.957
jan 1, 1986
Maximum:
109.157
jan 1, 2011
At the date of observation
Value
Absolute change
Change from previous value
jan 1, 1972
101.48
+101.48
0.0%
jan 1, 1973
100.372
-1.107
-1.09%
jan 1, 1974
99.198
-1.174
-1.17%
jan 1, 1975
98.105
-1.093
-1.1%
jan 1, 1976
97.367
-0.738
-0.75%
jan 1, 1977
97.816
+0.448
0.46%
jan 1, 1978
97.853
+0.037
0.04%
jan 1, 1979
98.089
+0.236
0.24%
jan 1, 1980
98.573
+0.485
0.49%
jan 1, 1981
99.053
+0.48
0.49%
jan 1, 1982
99.215
+0.162
0.16%
jan 1, 1983
98.138
-1.077
-1.09%
jan 1, 1984
96.548
-1.59
-1.62%
jan 1, 1985
95.241
-1.307
-1.35%
jan 1, 1986
94.957
-0.284
-0.3%
jan 1, 1987
99.546
+4.589
4.83%
jan 1, 1988
101.379
+1.833
1.84%
jan 1, 1989
103.237
+1.858
1.83%
jan 1, 1990
103.912
+0.674
0.65%
jan 1, 1991
103.741
-0.171
-0.16%
jan 1, 1992
103.121
-0.62
-0.6%
jan 1, 1993
98.212
-4.909
-4.76%
jan 1, 1994
97.646
-0.566
-0.58%
jan 1, 1995
107.976
+10.331
10.58%
jan 1, 1996
107.906
-0.071
-0.07%
jan 1, 1997
107.954
+0.049
0.05%
jan 1, 1998
108.312
+0.357
0.33%
jan 1, 1999
108.826
+0.515
0.48%
jan 1, 2000
108.729
-0.097
-0.09%
jan 1, 2001
108.6
-0.13
-0.12%
jan 1, 2002
108.109
-0.49
-0.45%
jan 1, 2003
107.896
-0.214
-0.2%
jan 1, 2004
107.836
-0.059
-0.05%
jan 1, 2005
107.123
-0.713
-0.66%
jan 1, 2006
106.864
-0.259
-0.24%
jan 1, 2007
107.093
+0.229
0.21%
jan 1, 2008
107.774
+0.681
0.64%
jan 1, 2009
108.454
+0.68
0.63%
jan 1, 2010
108.909
+0.455
0.42%
jan 1, 2011
109.157
+0.247
0.23%
jan 1, 2012
108.861
-0.296
-0.27%
jan 1, 2013
107.58
-1.281
-1.18%
jan 1, 2014
106.155
-1.425
-1.32%
jan 1, 2015
104.438
-1.717
-1.62%
Ranking of countries by current statistics by years


Comments: