29
/
en
AIzaSyAYiBZKx7MnpbEhh9jyipgxe19OcubqV5w
April 1, 2024
223617
Philippines
PHL
true
2
1
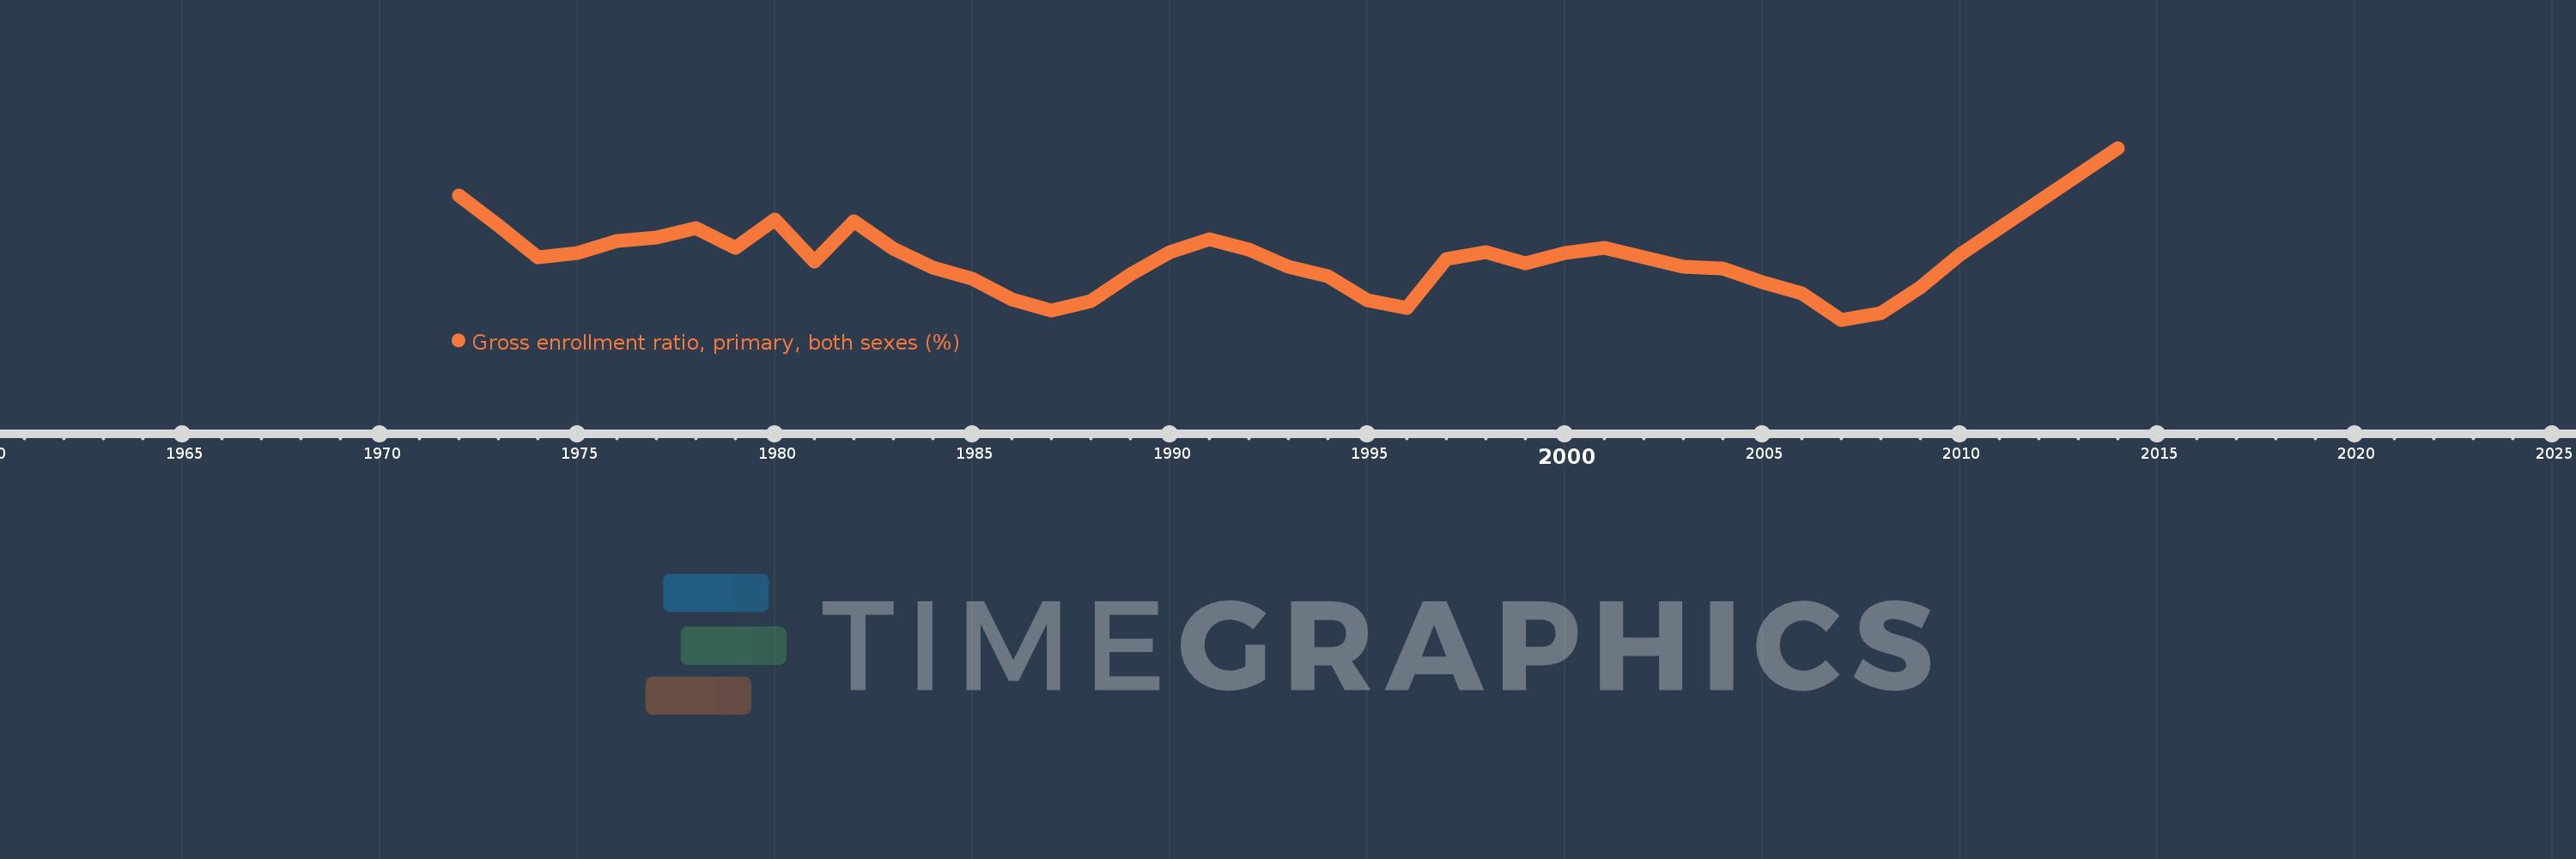
Gross enrollment ratio, primary, both sexes (%)
2014,2010,2009,2008,2007,2006,2005,2004,2003,2002,2001,2000,1999,1998,1997,1996,1995,1994,1993,1992,1991,1990,1989,1988,1987,1986,1985,1984,1983,1982,1981,1980,1979,1978,1977,1976,1975,1974,1973,1972
This statistics in other country:
AfghanistanAlbaniaAlgeriaAndorraAngolaAntigua and BarbudaArab WorldArgentinaArmeniaArubaAustraliaAustriaAzerbaijanBahamas, TheBahrainBangladeshBarbadosBelarusBelgiumBelizeBeninBermudaBhutanBoliviaBosnia and HerzegovinaBotswanaBrazilBritish Virgin IslandsBrunei DarussalamBulgariaBurkina FasoBurundiCabo VerdeCambodiaCameroonCanadaCaribbean small statesCentral African RepublicCentral Europe and the BalticsChadChileChinaColombiaComorosCongo, Dem. Rep.Congo, Rep.Costa RicaCote d'IvoireCroatiaCubaCuracaoCyprusCzech RepublicDenmarkDjiboutiDominicaDominican RepublicEarly-demographic dividendEast Asia & PacificEast Asia & Pacific (excluding high income)East Asia & Pacific (IDA & IBRD countries)EcuadorEgypt, Arab Rep.El SalvadorEquatorial GuineaEritreaEstoniaEthiopiaEuro areaEurope & Central AsiaEurope & Central Asia (excluding high income)Europe & Central Asia (IDA & IBRD countries)European UnionFijiFinlandFragile and conflict affected situationsFranceGabonGambia, TheGeorgiaGermanyGhanaGreeceGrenadaGuatemalaGuineaGuinea-BissauGuyanaHaitiHeavily indebted poor countries (HIPC)High incomeHondurasHong Kong SAR, ChinaHungaryIBRD onlyIcelandIDA & IBRD totalIDA blendIDA onlyIDA totalIndiaIndonesiaIran, Islamic Rep.IraqIrelandIsraelItalyJamaicaJapanJordanKazakhstanKenyaKiribatiKorea, Dem. People’s Rep.Korea, Rep.KuwaitKyrgyz RepublicLao PDRLate-demographic dividendLatin America & Caribbean Latin America & Caribbean (excluding high income)Latin America & the Caribbean (IDA & IBRD countries)LatviaLeast developed countries: UN classificationLebanonLesothoLiberiaLibyaLiechtensteinLithuaniaLow & middle incomeLow incomeLower middle incomeLuxembourgMacao SAR, ChinaMacedonia, FYRMadagascarMalawiMalaysiaMaldivesMaliMaltaMarshall IslandsMauritaniaMauritiusMexicoMicronesia, Fed. Sts.Middle East & North AfricaMiddle East & North Africa (excluding high income)Middle East & North Africa (IDA & IBRD countries)Middle incomeMoldovaMongoliaMontenegroMoroccoMozambiqueMyanmarNamibiaNauruNepalNetherlandsNew ZealandNicaraguaNigerNigeriaNorth AmericaNorwayOECD membersOmanOther small statesPacific island small statesPakistanPalauPanamaPapua New GuineaParaguayPeruPhilippinesPolandPortugalPost-demographic dividendPre-demographic dividendPuerto RicoQatarRomaniaRussian FederationRwandaSamoaSan MarinoSao Tome and PrincipeSaudi ArabiaSenegalSerbiaSeychellesSierra LeoneSlovak RepublicSloveniaSmall statesSolomon IslandsSomaliaSouth AfricaSouth AsiaSouth Asia (IDA & IBRD)South SudanSpainSri LankaSt. Kitts and NevisSt. LuciaSt. Vincent and the GrenadinesSub-Saharan Africa Sub-Saharan Africa (excluding high income)Sub-Saharan Africa (IDA & IBRD countries)SudanSurinameSwazilandSwedenSwitzerlandSyrian Arab RepublicTajikistanTanzaniaThailandTimor-LesteTogoTongaTrinidad and TobagoTunisiaTurkeyTurkmenistanTuvaluUgandaUkraineUnited Arab EmiratesUnited KingdomUnited StatesUpper middle incomeUruguayUzbekistanVanuatuVenezuela, RBVietnamWest Bank and GazaWorldYemen, Rep.ZambiaZimbabwe Timeline:
This timeline shows a graph from 1972 to 2014 of Philippines. No data until 1971. Number of actual observations by date: 40.
Source name:
World Development Indicators
Source organization:
UNESCO Institute for Statistics
Categories, topics:
Education
Last updated:
apr 23, 2017
Indicators value changes by year
Minimum:
104.032
jan 1, 2007
Maximum:
116.819
jan 1, 2014
At the date of observation
Value
Absolute change
Change from previous value
jan 1, 1972
113.301
+113.301
0.0%
jan 1, 1973
111.052
-2.249
-1.98%
jan 1, 1974
108.692
-2.361
-2.13%
jan 1, 1975
109.017
+0.325
0.3%
jan 1, 1976
109.914
+0.898
0.82%
jan 1, 1977
110.135
+0.221
0.2%
jan 1, 1978
110.881
+0.746
0.68%
jan 1, 1979
109.371
-1.509
-1.36%
jan 1, 1980
111.474
+2.102
1.92%
jan 1, 1981
108.349
-3.125
-2.8%
jan 1, 1982
111.362
+3.014
2.78%
jan 1, 1983
109.323
-2.039
-1.83%
jan 1, 1984
107.939
-1.384
-1.27%
jan 1, 1985
107.093
-0.846
-0.78%
jan 1, 1986
105.571
-1.522
-1.42%
jan 1, 1987
104.713
-0.859
-0.81%
jan 1, 1988
105.411
+0.698
0.67%
jan 1, 1989
107.398
+1.987
1.89%
jan 1, 1990
109.054
+1.656
1.54%
jan 1, 1991
110.051
+0.997
0.91%
jan 1, 1992
109.285
-0.766
-0.7%
jan 1, 1993
107.998
-1.286
-1.18%
jan 1, 1994
107.279
-0.719
-0.67%
jan 1, 1995
105.491
-1.788
-1.67%
jan 1, 1996
104.899
-0.592
-0.56%
jan 1, 1997
108.581
+3.682
3.51%
jan 1, 1998
109.055
+0.474
0.44%
jan 1, 1999
108.211
-0.844
-0.77%
jan 1, 2000
108.988
+0.777
0.72%
jan 1, 2001
109.388
+0.399
0.37%
jan 1, 2002
108.685
-0.703
-0.64%
jan 1, 2003
107.974
-0.711
-0.65%
jan 1, 2004
107.819
-0.155
-0.14%
jan 1, 2005
106.823
-0.997
-0.92%
jan 1, 2006
105.988
-0.834
-0.78%
jan 1, 2007
104.032
-1.957
-1.85%
jan 1, 2008
104.519
+0.487
0.47%
jan 1, 2009
106.445
+1.926
1.84%
jan 1, 2010
108.875
+2.429
2.28%
jan 1, 2014
116.819
+7.944
7.3%
Ranking of countries by current statistics by years


Comments: