29
/
en
AIzaSyAYiBZKx7MnpbEhh9jyipgxe19OcubqV5w
April 1, 2024
101138
Canada
CAN
true
2
1
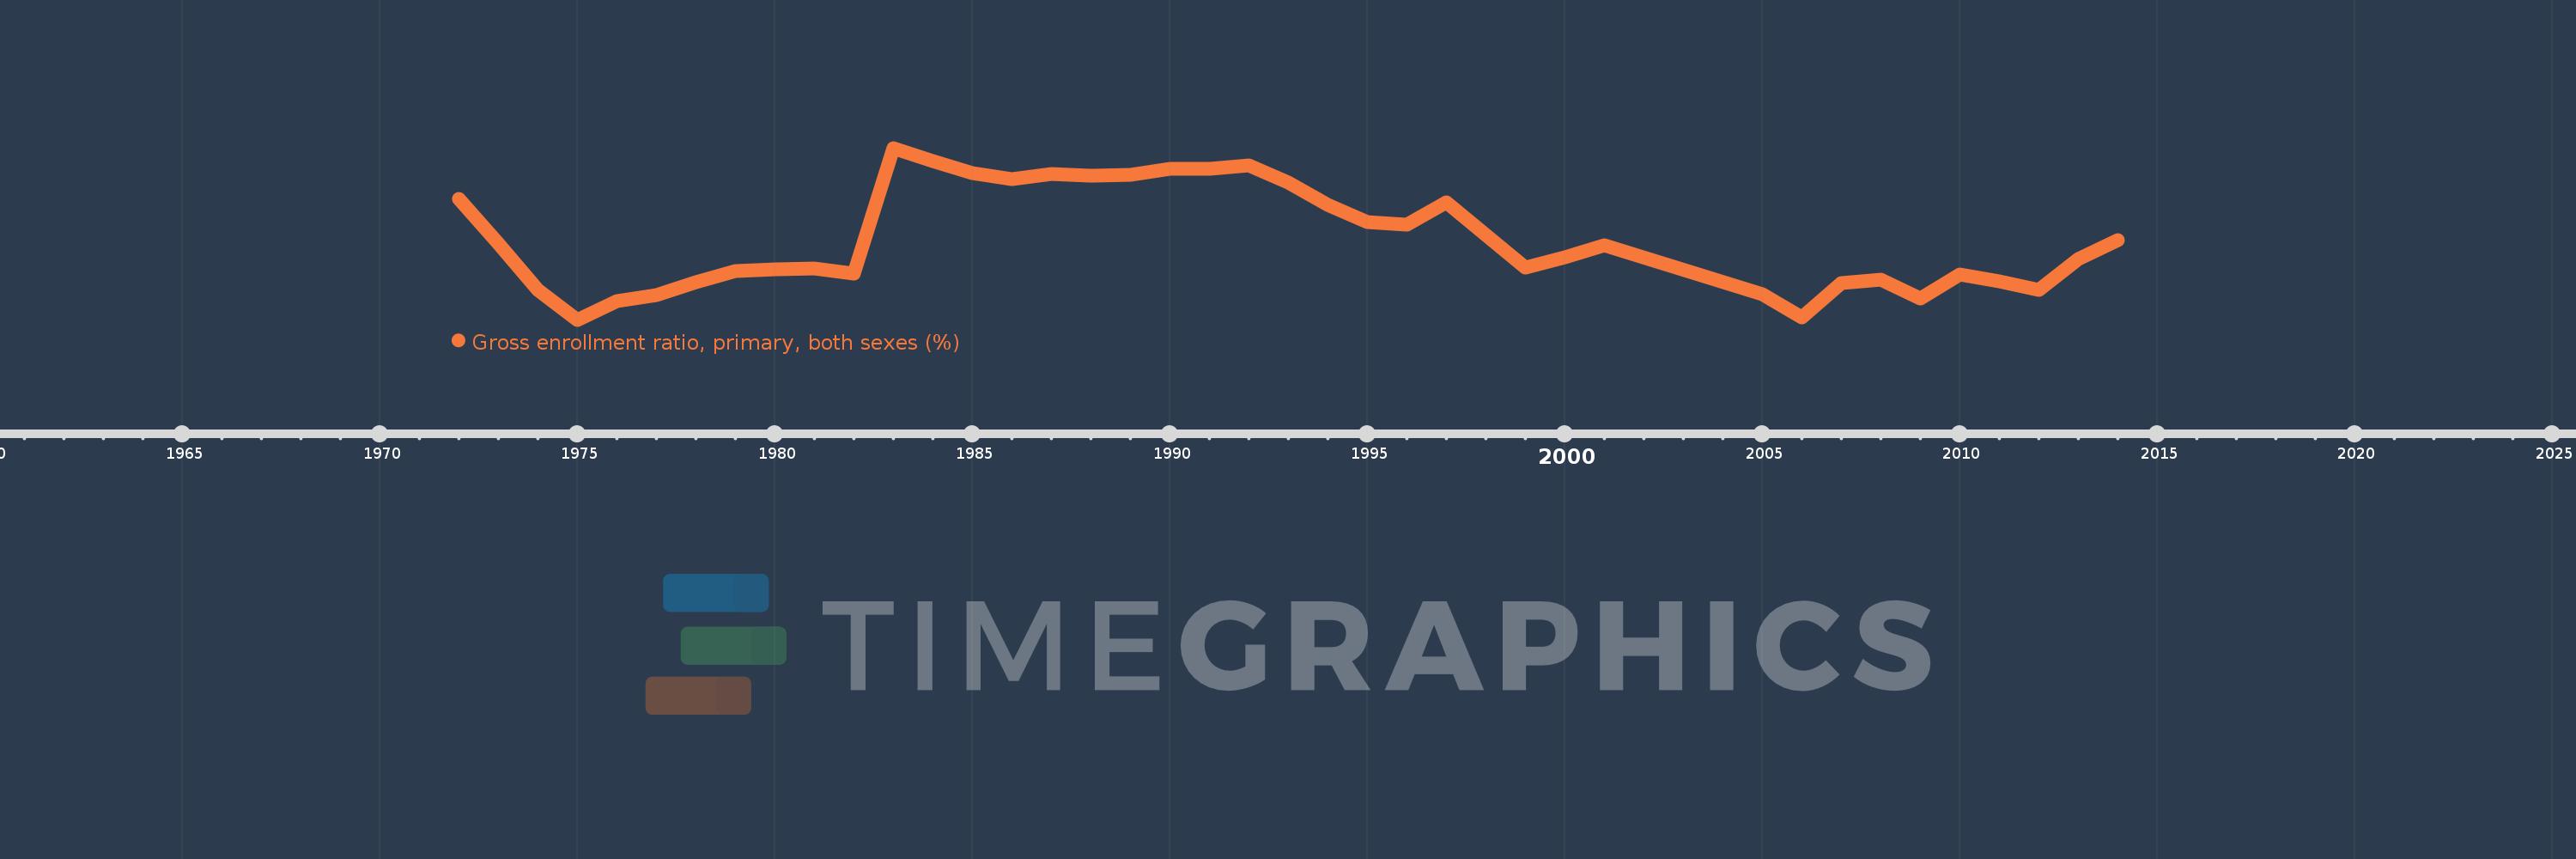
Gross enrollment ratio, primary, both sexes (%)
2014,2013,2012,2011,2010,2009,2008,2007,2006,2005,2001,2000,1999,1997,1996,1995,1994,1993,1992,1991,1990,1989,1988,1987,1986,1985,1984,1983,1982,1981,1980,1979,1978,1977,1976,1975,1974,1973,1972
This statistics in other country:
AfghanistanAlbaniaAlgeriaAndorraAngolaAntigua and BarbudaArab WorldArgentinaArmeniaArubaAustraliaAustriaAzerbaijanBahamas, TheBahrainBangladeshBarbadosBelarusBelgiumBelizeBeninBermudaBhutanBoliviaBosnia and HerzegovinaBotswanaBrazilBritish Virgin IslandsBrunei DarussalamBulgariaBurkina FasoBurundiCabo VerdeCambodiaCameroonCanadaCaribbean small statesCentral African RepublicCentral Europe and the BalticsChadChileChinaColombiaComorosCongo, Dem. Rep.Congo, Rep.Costa RicaCote d'IvoireCroatiaCubaCuracaoCyprusCzech RepublicDenmarkDjiboutiDominicaDominican RepublicEarly-demographic dividendEast Asia & PacificEast Asia & Pacific (excluding high income)East Asia & Pacific (IDA & IBRD countries)EcuadorEgypt, Arab Rep.El SalvadorEquatorial GuineaEritreaEstoniaEthiopiaEuro areaEurope & Central AsiaEurope & Central Asia (excluding high income)Europe & Central Asia (IDA & IBRD countries)European UnionFijiFinlandFragile and conflict affected situationsFranceGabonGambia, TheGeorgiaGermanyGhanaGreeceGrenadaGuatemalaGuineaGuinea-BissauGuyanaHaitiHeavily indebted poor countries (HIPC)High incomeHondurasHong Kong SAR, ChinaHungaryIBRD onlyIcelandIDA & IBRD totalIDA blendIDA onlyIDA totalIndiaIndonesiaIran, Islamic Rep.IraqIrelandIsraelItalyJamaicaJapanJordanKazakhstanKenyaKiribatiKorea, Dem. People’s Rep.Korea, Rep.KuwaitKyrgyz RepublicLao PDRLate-demographic dividendLatin America & Caribbean Latin America & Caribbean (excluding high income)Latin America & the Caribbean (IDA & IBRD countries)LatviaLeast developed countries: UN classificationLebanonLesothoLiberiaLibyaLiechtensteinLithuaniaLow & middle incomeLow incomeLower middle incomeLuxembourgMacao SAR, ChinaMacedonia, FYRMadagascarMalawiMalaysiaMaldivesMaliMaltaMarshall IslandsMauritaniaMauritiusMexicoMicronesia, Fed. Sts.Middle East & North AfricaMiddle East & North Africa (excluding high income)Middle East & North Africa (IDA & IBRD countries)Middle incomeMoldovaMongoliaMontenegroMoroccoMozambiqueMyanmarNamibiaNauruNepalNetherlandsNew ZealandNicaraguaNigerNigeriaNorth AmericaNorwayOECD membersOmanOther small statesPacific island small statesPakistanPalauPanamaPapua New GuineaParaguayPeruPhilippinesPolandPortugalPost-demographic dividendPre-demographic dividendPuerto RicoQatarRomaniaRussian FederationRwandaSamoaSan MarinoSao Tome and PrincipeSaudi ArabiaSenegalSerbiaSeychellesSierra LeoneSlovak RepublicSloveniaSmall statesSolomon IslandsSomaliaSouth AfricaSouth AsiaSouth Asia (IDA & IBRD)South SudanSpainSri LankaSt. Kitts and NevisSt. LuciaSt. Vincent and the GrenadinesSub-Saharan Africa Sub-Saharan Africa (excluding high income)Sub-Saharan Africa (IDA & IBRD countries)SudanSurinameSwazilandSwedenSwitzerlandSyrian Arab RepublicTajikistanTanzaniaThailandTimor-LesteTogoTongaTrinidad and TobagoTunisiaTurkeyTurkmenistanTuvaluUgandaUkraineUnited Arab EmiratesUnited KingdomUnited StatesUpper middle incomeUruguayUzbekistanVanuatuVenezuela, RBVietnamWest Bank and GazaWorldYemen, Rep.ZambiaZimbabwe Timeline:
This timeline shows a graph from 1972 to 2014 of Canada. No data until 1971. Number of actual observations by date: 39.
Source name:
World Development Indicators
Source organization:
UNESCO Institute for Statistics
Categories, topics:
Education
Last updated:
apr 23, 2017
Indicators value changes by year
Minimum:
96.955
jan 1, 1975
Maximum:
104.733
jan 1, 1983
At the date of observation
Value
Absolute change
Change from previous value
jan 1, 1972
102.42
+102.42
0.0%
jan 1, 1973
100.423
-1.997
-1.95%
jan 1, 1974
98.32
-2.103
-2.09%
jan 1, 1975
96.955
-1.365
-1.39%
jan 1, 1976
97.798
+0.843
0.87%
jan 1, 1977
98.069
+0.271
0.28%
jan 1, 1978
98.65
+0.581
0.59%
jan 1, 1979
99.165
+0.516
0.52%
jan 1, 1980
99.225
+0.06
0.06%
jan 1, 1981
99.283
+0.058
0.06%
jan 1, 1982
99.025
-0.258
-0.26%
jan 1, 1983
104.733
+5.708
5.76%
jan 1, 1984
104.146
-0.588
-0.56%
jan 1, 1985
103.581
-0.565
-0.54%
jan 1, 1986
103.305
-0.276
-0.27%
jan 1, 1987
103.547
+0.242
0.23%
jan 1, 1988
103.476
-0.071
-0.07%
jan 1, 1989
103.522
+0.046
0.04%
jan 1, 1990
103.779
+0.257
0.25%
jan 1, 1991
103.785
+0.006
0.01%
jan 1, 1992
103.931
+0.147
0.14%
jan 1, 1993
103.152
-0.779
-0.75%
jan 1, 1994
102.169
-0.983
-0.95%
jan 1, 1995
101.368
-0.801
-0.78%
jan 1, 1996
101.274
-0.094
-0.09%
jan 1, 1997
102.271
+0.997
0.98%
jan 1, 1999
99.327
-2.945
-2.88%
jan 1, 2000
99.783
+0.456
0.46%
jan 1, 2001
100.333
+0.55
0.55%
jan 1, 2005
98.117
-2.216
-2.21%
jan 1, 2006
97.056
-1.061
-1.08%
jan 1, 2007
98.631
+1.576
1.62%
jan 1, 2008
98.786
+0.155
0.16%
jan 1, 2009
97.913
-0.873
-0.88%
jan 1, 2010
98.987
+1.074
1.1%
jan 1, 2011
98.69
-0.297
-0.3%
jan 1, 2012
98.295
-0.394
-0.4%
jan 1, 2013
99.694
+1.398
1.42%
jan 1, 2014
100.572
+0.879
0.88%
Ranking of countries by current statistics by years


Comments: