29
/
en
AIzaSyAYiBZKx7MnpbEhh9jyipgxe19OcubqV5w
April 1, 2024
73025
Australia
AUS
true
2
1
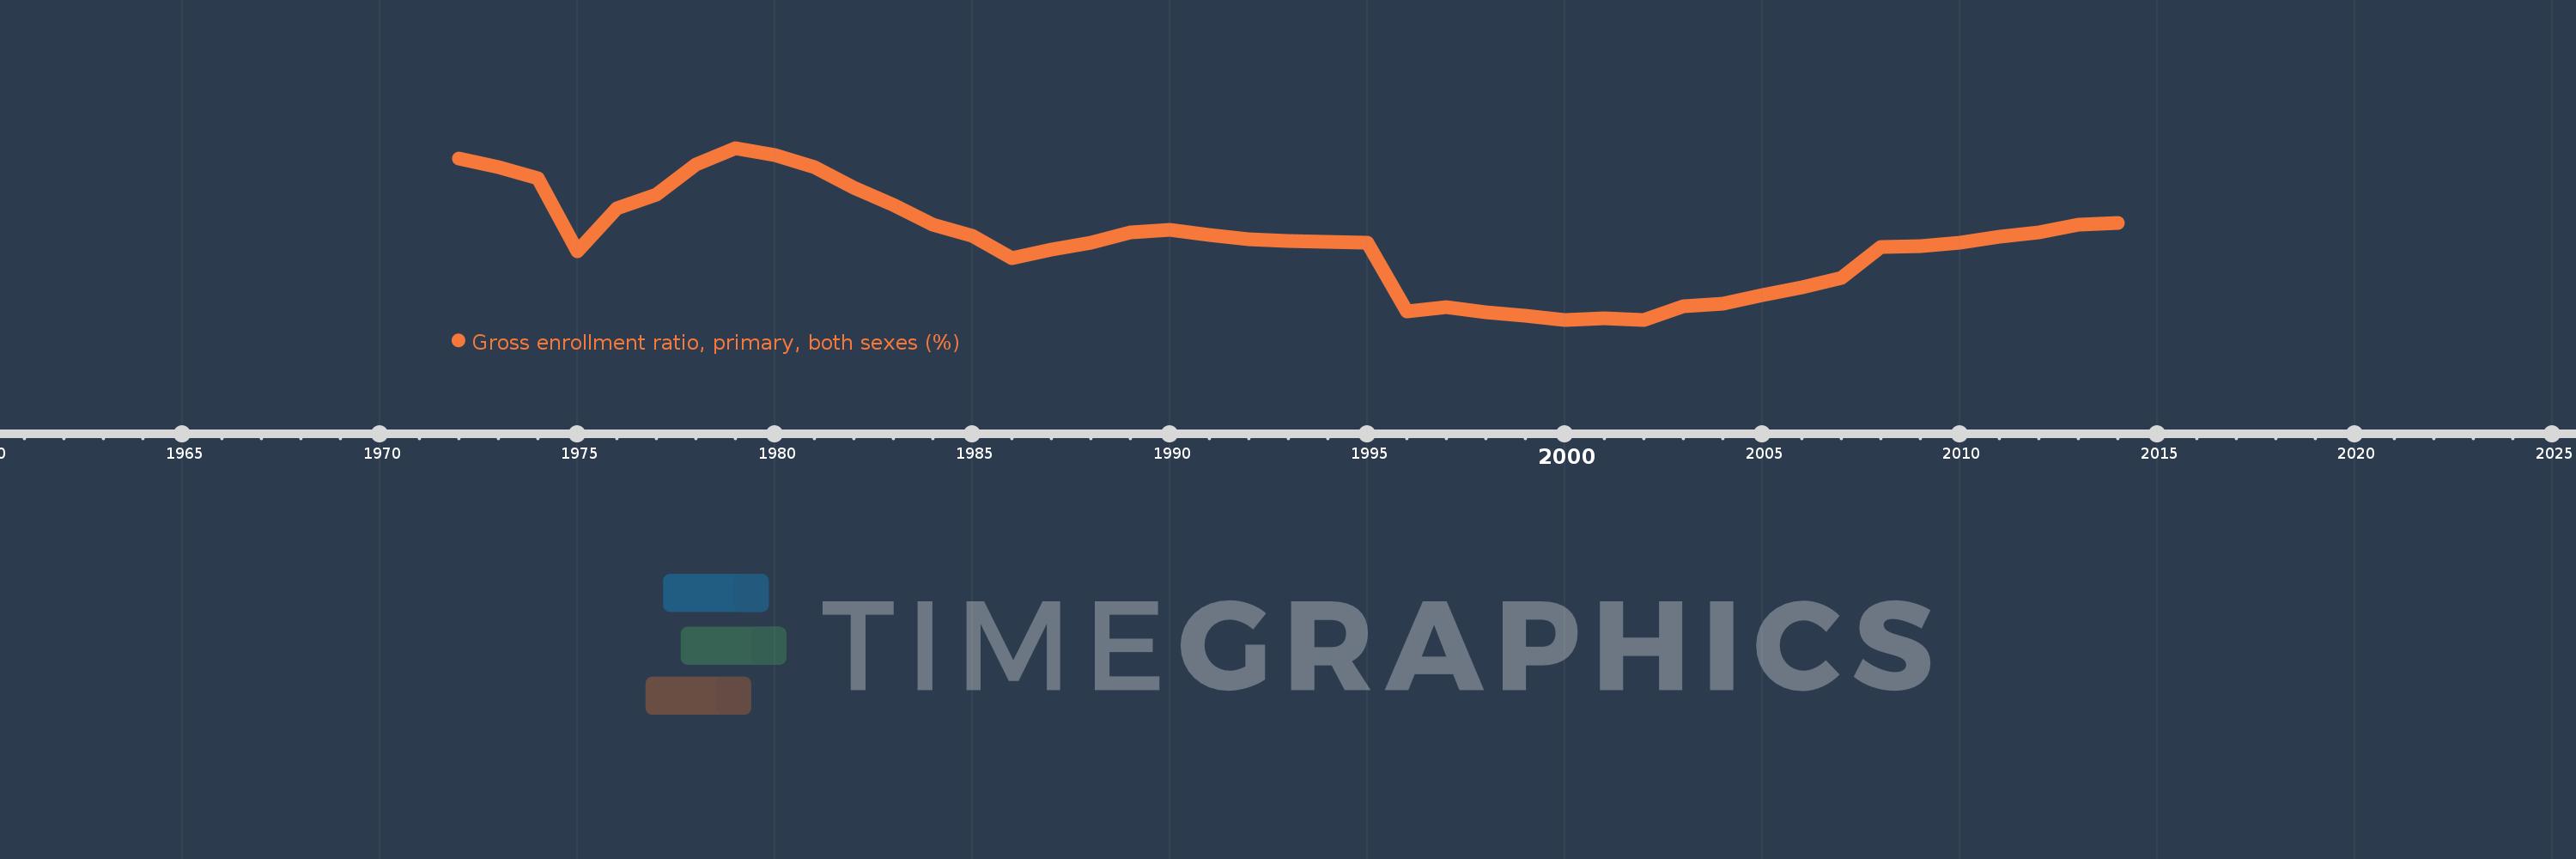
Gross enrollment ratio, primary, both sexes (%)
2014,2013,2012,2011,2010,2009,2008,2007,2006,2005,2004,2003,2002,2001,2000,1999,1998,1997,1996,1995,1994,1993,1992,1991,1990,1989,1988,1987,1986,1985,1984,1983,1982,1981,1980,1979,1978,1977,1976,1975,1974,1973,1972
This statistics in other country:
AfghanistanAlbaniaAlgeriaAndorraAngolaAntigua and BarbudaArab WorldArgentinaArmeniaArubaAustraliaAustriaAzerbaijanBahamas, TheBahrainBangladeshBarbadosBelarusBelgiumBelizeBeninBermudaBhutanBoliviaBosnia and HerzegovinaBotswanaBrazilBritish Virgin IslandsBrunei DarussalamBulgariaBurkina FasoBurundiCabo VerdeCambodiaCameroonCanadaCaribbean small statesCentral African RepublicCentral Europe and the BalticsChadChileChinaColombiaComorosCongo, Dem. Rep.Congo, Rep.Costa RicaCote d'IvoireCroatiaCubaCuracaoCyprusCzech RepublicDenmarkDjiboutiDominicaDominican RepublicEarly-demographic dividendEast Asia & PacificEast Asia & Pacific (excluding high income)East Asia & Pacific (IDA & IBRD countries)EcuadorEgypt, Arab Rep.El SalvadorEquatorial GuineaEritreaEstoniaEthiopiaEuro areaEurope & Central AsiaEurope & Central Asia (excluding high income)Europe & Central Asia (IDA & IBRD countries)European UnionFijiFinlandFragile and conflict affected situationsFranceGabonGambia, TheGeorgiaGermanyGhanaGreeceGrenadaGuatemalaGuineaGuinea-BissauGuyanaHaitiHeavily indebted poor countries (HIPC)High incomeHondurasHong Kong SAR, ChinaHungaryIBRD onlyIcelandIDA & IBRD totalIDA blendIDA onlyIDA totalIndiaIndonesiaIran, Islamic Rep.IraqIrelandIsraelItalyJamaicaJapanJordanKazakhstanKenyaKiribatiKorea, Dem. People’s Rep.Korea, Rep.KuwaitKyrgyz RepublicLao PDRLate-demographic dividendLatin America & Caribbean Latin America & Caribbean (excluding high income)Latin America & the Caribbean (IDA & IBRD countries)LatviaLeast developed countries: UN classificationLebanonLesothoLiberiaLibyaLiechtensteinLithuaniaLow & middle incomeLow incomeLower middle incomeLuxembourgMacao SAR, ChinaMacedonia, FYRMadagascarMalawiMalaysiaMaldivesMaliMaltaMarshall IslandsMauritaniaMauritiusMexicoMicronesia, Fed. Sts.Middle East & North AfricaMiddle East & North Africa (excluding high income)Middle East & North Africa (IDA & IBRD countries)Middle incomeMoldovaMongoliaMontenegroMoroccoMozambiqueMyanmarNamibiaNauruNepalNetherlandsNew ZealandNicaraguaNigerNigeriaNorth AmericaNorwayOECD membersOmanOther small statesPacific island small statesPakistanPalauPanamaPapua New GuineaParaguayPeruPhilippinesPolandPortugalPost-demographic dividendPre-demographic dividendPuerto RicoQatarRomaniaRussian FederationRwandaSamoaSan MarinoSao Tome and PrincipeSaudi ArabiaSenegalSerbiaSeychellesSierra LeoneSlovak RepublicSloveniaSmall statesSolomon IslandsSomaliaSouth AfricaSouth AsiaSouth Asia (IDA & IBRD)South SudanSpainSri LankaSt. Kitts and NevisSt. LuciaSt. Vincent and the GrenadinesSub-Saharan Africa Sub-Saharan Africa (excluding high income)Sub-Saharan Africa (IDA & IBRD countries)SudanSurinameSwazilandSwedenSwitzerlandSyrian Arab RepublicTajikistanTanzaniaThailandTimor-LesteTogoTongaTrinidad and TobagoTunisiaTurkeyTurkmenistanTuvaluUgandaUkraineUnited Arab EmiratesUnited KingdomUnited StatesUpper middle incomeUruguayUzbekistanVanuatuVenezuela, RBVietnamWest Bank and GazaWorldYemen, Rep.ZambiaZimbabwe Timeline:
This timeline shows a graph from 1972 to 2014 of Australia. No data until 1971. Number of actual observations by date: 43.
Source name:
World Development Indicators
Source organization:
UNESCO Institute for Statistics
Categories, topics:
Education
Last updated:
apr 23, 2017
Indicators value changes by year
Minimum:
100.252
jan 1, 2002
Maximum:
111.492
jan 1, 1979
At the date of observation
Value
Absolute change
Change from previous value
jan 1, 1972
110.806
+110.806
0.0%
jan 1, 1973
110.218
-0.588
-0.53%
jan 1, 1974
109.527
-0.692
-0.63%
jan 1, 1975
104.715
-4.812
-4.39%
jan 1, 1976
107.558
+2.843
2.72%
jan 1, 1977
108.445
+0.887
0.82%
jan 1, 1978
110.432
+1.986
1.83%
jan 1, 1979
111.492
+1.06
0.96%
jan 1, 1980
111.05
-0.441
-0.4%
jan 1, 1981
110.231
-0.819
-0.74%
jan 1, 1982
108.878
-1.354
-1.23%
jan 1, 1983
107.787
-1.091
-1.0%
jan 1, 1984
106.471
-1.316
-1.22%
jan 1, 1985
105.748
-0.723
-0.68%
jan 1, 1986
104.271
-1.477
-1.4%
jan 1, 1987
104.856
+0.585
0.56%
jan 1, 1988
105.305
+0.449
0.43%
jan 1, 1989
105.945
+0.64
0.61%
jan 1, 1990
106.137
+0.192
0.18%
jan 1, 1991
105.812
-0.326
-0.31%
jan 1, 1992
105.532
-0.28
-0.26%
jan 1, 1993
105.412
-0.12
-0.11%
jan 1, 1994
105.325
-0.087
-0.08%
jan 1, 1995
105.292
-0.033
-0.03%
jan 1, 1996
100.793
-4.5
-4.27%
jan 1, 1997
101.099
+0.306
0.3%
jan 1, 1998
100.73
-0.37
-0.37%
jan 1, 1999
100.501
-0.228
-0.23%
jan 1, 2000
100.256
-0.245
-0.24%
jan 1, 2001
100.337
+0.081
0.08%
jan 1, 2002
100.252
-0.086
-0.09%
jan 1, 2003
101.15
+0.898
0.9%
jan 1, 2004
101.275
+0.125
0.12%
jan 1, 2005
101.879
+0.604
0.6%
jan 1, 2006
102.389
+0.51
0.5%
jan 1, 2007
103.011
+0.622
0.61%
jan 1, 2008
104.985
+1.974
1.92%
jan 1, 2009
105.058
+0.073
0.07%
jan 1, 2010
105.319
+0.261
0.25%
jan 1, 2011
105.704
+0.385
0.37%
jan 1, 2012
105.992
+0.287
0.27%
jan 1, 2013
106.453
+0.462
0.44%
jan 1, 2014
106.568
+0.114
0.11%
Ranking of countries by current statistics by years


Comments: