29
/
en
AIzaSyAYiBZKx7MnpbEhh9jyipgxe19OcubqV5w
April 1, 2024
248766
Sri Lanka
LKA
true
2
1
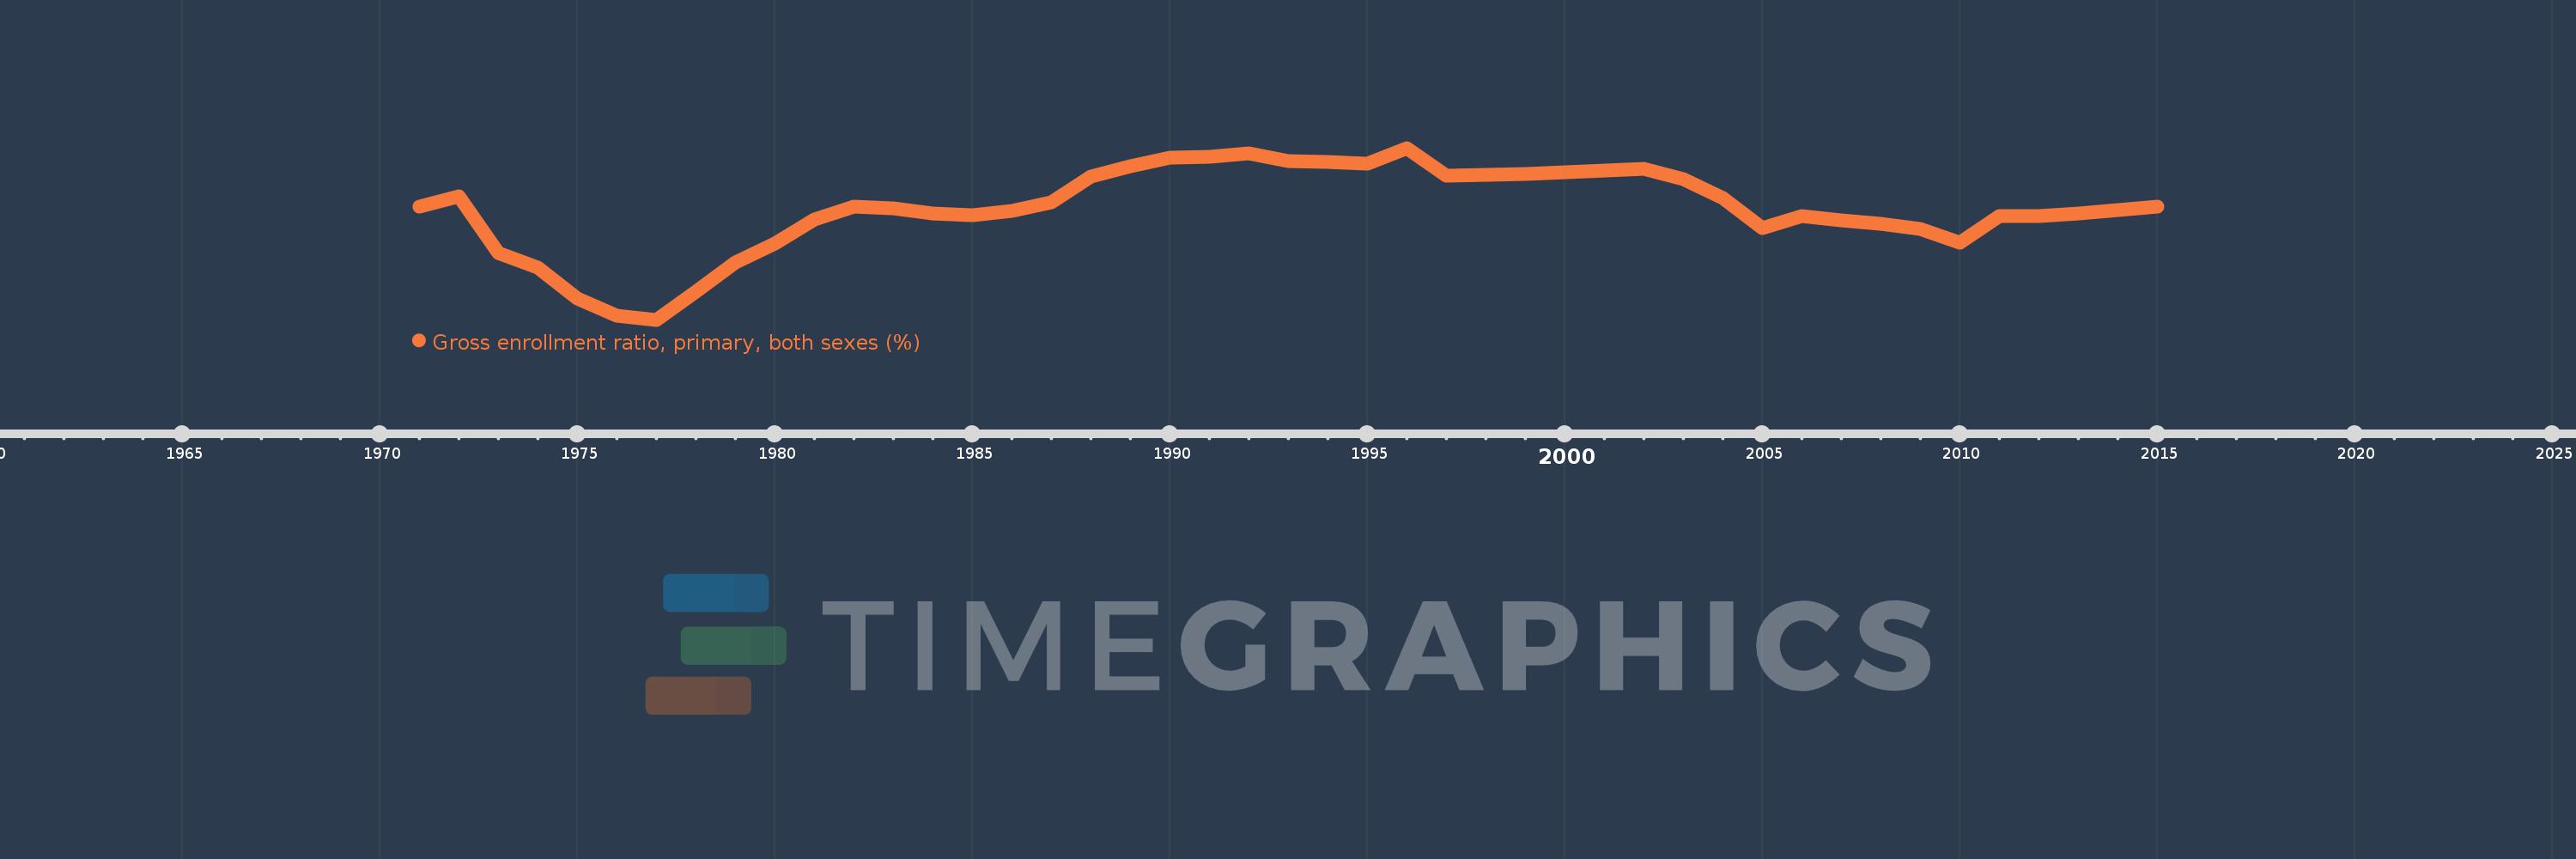
Gross enrollment ratio, primary, both sexes (%)
2015,2014,2013,2012,2011,2010,2009,2008,2007,2006,2005,2004,2003,2002,1999,1997,1996,1995,1994,1993,1992,1991,1990,1989,1988,1987,1986,1985,1984,1983,1982,1981,1980,1979,1978,1977,1976,1975,1974,1973,1972,1971
This statistics in other country:
AfghanistanAlbaniaAlgeriaAndorraAngolaAntigua and BarbudaArab WorldArgentinaArmeniaArubaAustraliaAustriaAzerbaijanBahamas, TheBahrainBangladeshBarbadosBelarusBelgiumBelizeBeninBermudaBhutanBoliviaBosnia and HerzegovinaBotswanaBrazilBritish Virgin IslandsBrunei DarussalamBulgariaBurkina FasoBurundiCabo VerdeCambodiaCameroonCanadaCaribbean small statesCentral African RepublicCentral Europe and the BalticsChadChileChinaColombiaComorosCongo, Dem. Rep.Congo, Rep.Costa RicaCote d'IvoireCroatiaCubaCuracaoCyprusCzech RepublicDenmarkDjiboutiDominicaDominican RepublicEarly-demographic dividendEast Asia & PacificEast Asia & Pacific (excluding high income)East Asia & Pacific (IDA & IBRD countries)EcuadorEgypt, Arab Rep.El SalvadorEquatorial GuineaEritreaEstoniaEthiopiaEuro areaEurope & Central AsiaEurope & Central Asia (excluding high income)Europe & Central Asia (IDA & IBRD countries)European UnionFijiFinlandFragile and conflict affected situationsFranceGabonGambia, TheGeorgiaGermanyGhanaGreeceGrenadaGuatemalaGuineaGuinea-BissauGuyanaHaitiHeavily indebted poor countries (HIPC)High incomeHondurasHong Kong SAR, ChinaHungaryIBRD onlyIcelandIDA & IBRD totalIDA blendIDA onlyIDA totalIndiaIndonesiaIran, Islamic Rep.IraqIrelandIsraelItalyJamaicaJapanJordanKazakhstanKenyaKiribatiKorea, Dem. People’s Rep.Korea, Rep.KuwaitKyrgyz RepublicLao PDRLate-demographic dividendLatin America & Caribbean Latin America & Caribbean (excluding high income)Latin America & the Caribbean (IDA & IBRD countries)LatviaLeast developed countries: UN classificationLebanonLesothoLiberiaLibyaLiechtensteinLithuaniaLow & middle incomeLow incomeLower middle incomeLuxembourgMacao SAR, ChinaMacedonia, FYRMadagascarMalawiMalaysiaMaldivesMaliMaltaMarshall IslandsMauritaniaMauritiusMexicoMicronesia, Fed. Sts.Middle East & North AfricaMiddle East & North Africa (excluding high income)Middle East & North Africa (IDA & IBRD countries)Middle incomeMoldovaMongoliaMontenegroMoroccoMozambiqueMyanmarNamibiaNauruNepalNetherlandsNew ZealandNicaraguaNigerNigeriaNorth AmericaNorwayOECD membersOmanOther small statesPacific island small statesPakistanPalauPanamaPapua New GuineaParaguayPeruPhilippinesPolandPortugalPost-demographic dividendPre-demographic dividendPuerto RicoQatarRomaniaRussian FederationRwandaSamoaSan MarinoSao Tome and PrincipeSaudi ArabiaSenegalSerbiaSeychellesSierra LeoneSlovak RepublicSloveniaSmall statesSolomon IslandsSomaliaSouth AfricaSouth AsiaSouth Asia (IDA & IBRD)South SudanSpainSri LankaSt. Kitts and NevisSt. LuciaSt. Vincent and the GrenadinesSub-Saharan Africa Sub-Saharan Africa (excluding high income)Sub-Saharan Africa (IDA & IBRD countries)SudanSurinameSwazilandSwedenSwitzerlandSyrian Arab RepublicTajikistanTanzaniaThailandTimor-LesteTogoTongaTrinidad and TobagoTunisiaTurkeyTurkmenistanTuvaluUgandaUkraineUnited Arab EmiratesUnited KingdomUnited StatesUpper middle incomeUruguayUzbekistanVanuatuVenezuela, RBVietnamWest Bank and GazaWorldYemen, Rep.ZambiaZimbabwe Timeline:
This timeline shows a graph from 1971 to 2015 of Sri Lanka. No data until 1970. Number of actual observations by date: 42.
Source name:
World Development Indicators
Source organization:
UNESCO Institute for Statistics
Categories, topics:
Education
Last updated:
apr 23, 2017
Indicators value changes by year
Minimum:
81.903
jan 1, 1977
Maximum:
111.356
jan 1, 1996
At the date of observation
Value
Absolute change
Change from previous value
jan 1, 1971
101.315
+101.315
0.0%
jan 1, 1972
103.138
+1.823
1.8%
jan 1, 1973
93.408
-9.73
-9.43%
jan 1, 1974
90.801
-2.607
-2.79%
jan 1, 1975
85.549
-5.252
-5.78%
jan 1, 1976
82.588
-2.961
-3.46%
jan 1, 1977
81.903
-0.685
-0.83%
jan 1, 1978
86.775
+4.871
5.95%
jan 1, 1979
91.707
+4.932
5.68%
jan 1, 1980
94.95
+3.243
3.54%
jan 1, 1981
99.025
+4.075
4.29%
jan 1, 1982
101.264
+2.239
2.26%
jan 1, 1983
100.93
-0.333
-0.33%
jan 1, 1984
100.064
-0.866
-0.86%
jan 1, 1985
99.804
-0.26
-0.26%
jan 1, 1986
100.613
+0.809
0.81%
jan 1, 1987
102.032
+1.42
1.41%
jan 1, 1988
106.389
+4.356
4.27%
jan 1, 1989
108.221
+1.833
1.72%
jan 1, 1990
109.688
+1.467
1.36%
jan 1, 1991
109.876
+0.188
0.17%
jan 1, 1992
110.469
+0.593
0.54%
jan 1, 1993
109.109
-1.36
-1.23%
jan 1, 1994
108.891
-0.218
-0.2%
jan 1, 1995
108.727
-0.164
-0.15%
jan 1, 1996
111.356
+2.63
2.42%
jan 1, 1997
106.616
-4.741
-4.26%
jan 1, 1999
106.954
+0.339
0.32%
jan 1, 2002
107.768
+0.814
0.76%
jan 1, 2003
106.028
-1.741
-1.62%
jan 1, 2004
102.779
-3.248
-3.06%
jan 1, 2005
97.676
-5.103
-4.97%
jan 1, 2006
99.627
+1.951
2.0%
jan 1, 2007
98.975
-0.652
-0.65%
jan 1, 2008
98.387
-0.589
-0.59%
jan 1, 2009
97.414
-0.973
-0.99%
jan 1, 2010
95.078
-2.336
-2.4%
jan 1, 2011
99.707
+4.629
4.87%
jan 1, 2012
99.742
+0.034
0.03%
jan 1, 2013
100.096
+0.354
0.36%
jan 1, 2014
100.649
+0.553
0.55%
jan 1, 2015
101.27
+0.622
0.62%
Ranking of countries by current statistics by years


Comments: