29
/
en
AIzaSyAYiBZKx7MnpbEhh9jyipgxe19OcubqV5w
April 1, 2024
275742
United Kingdom
GBR
true
2
1
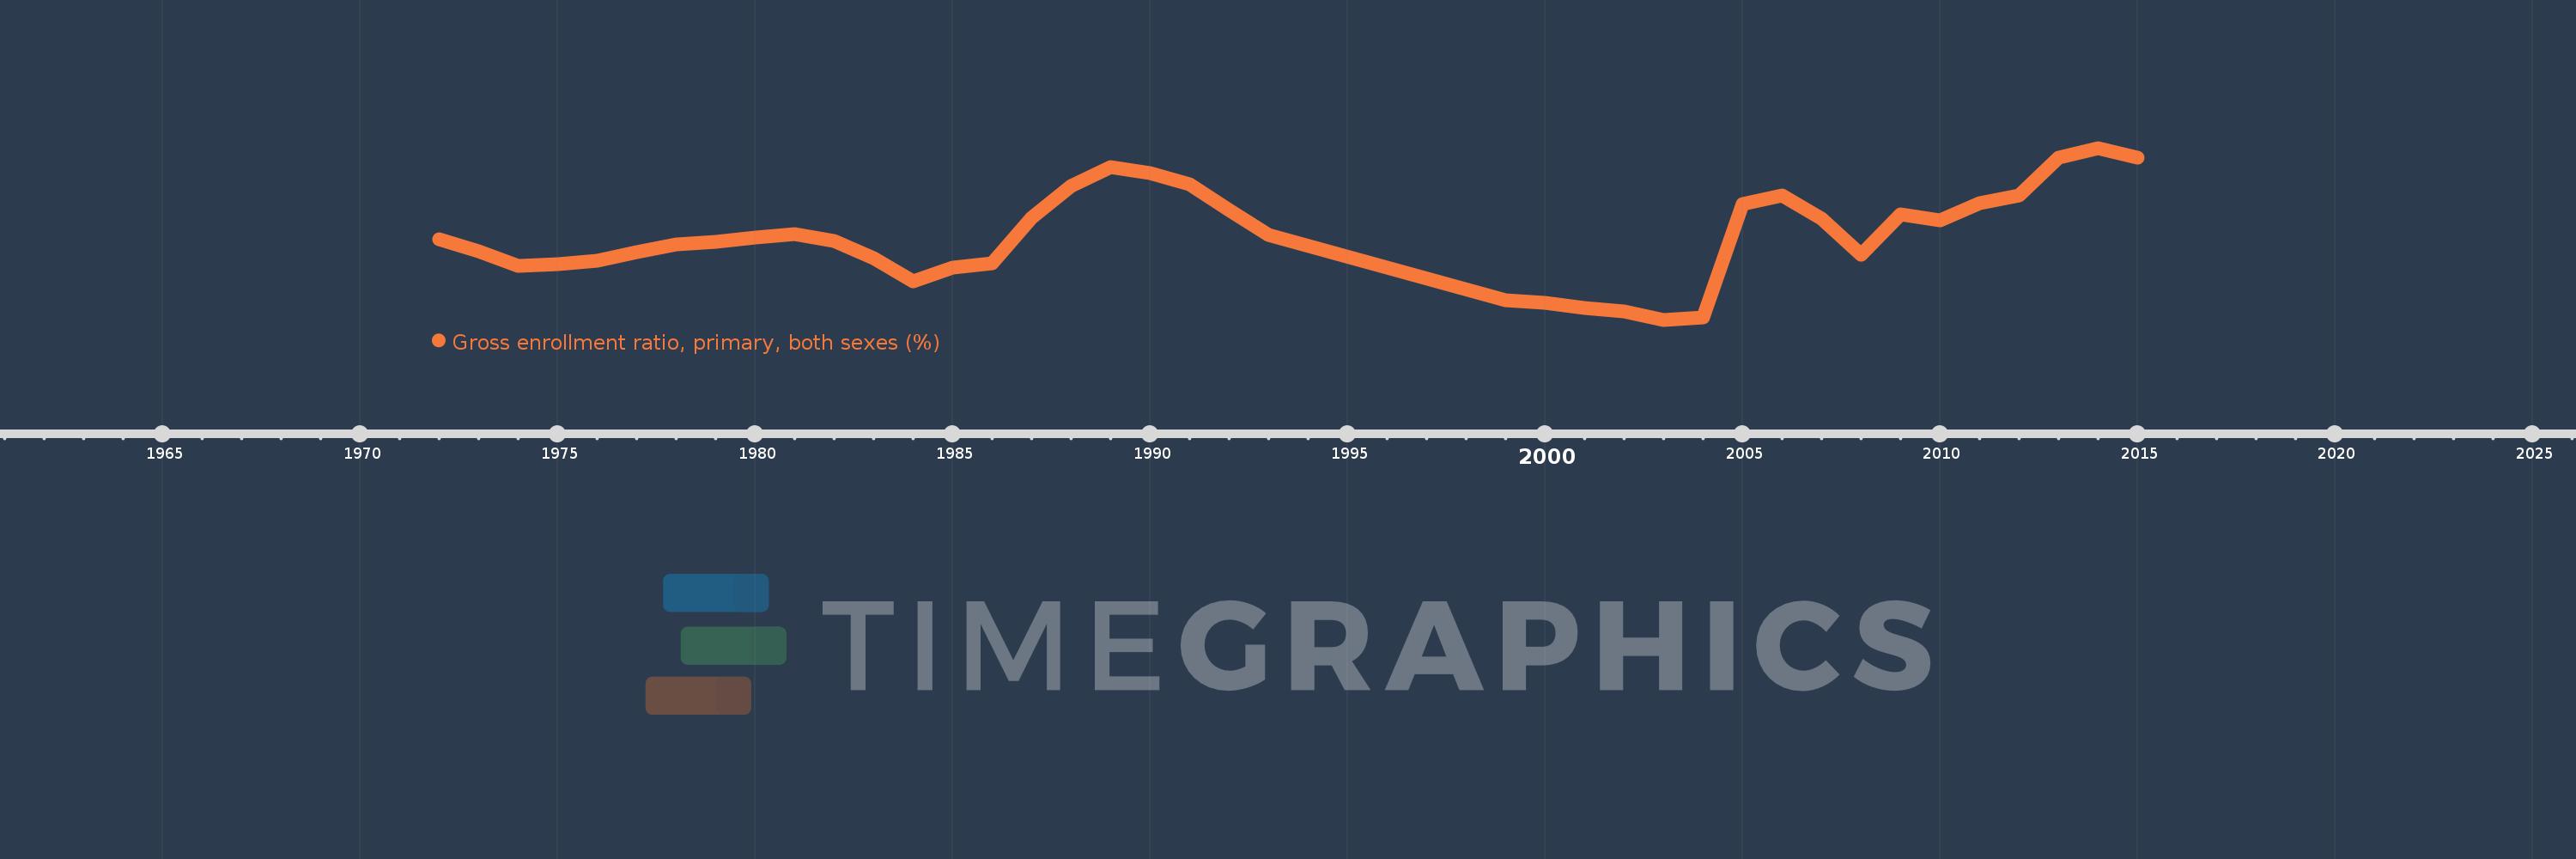
Gross enrollment ratio, primary, both sexes (%)
2015,2014,2013,2012,2011,2010,2009,2008,2007,2006,2005,2004,2003,2002,2001,2000,1999,1993,1992,1991,1990,1989,1988,1987,1986,1985,1984,1983,1982,1981,1980,1979,1978,1977,1976,1975,1974,1973,1972
This statistics in other country:
AfghanistanAlbaniaAlgeriaAndorraAngolaAntigua and BarbudaArab WorldArgentinaArmeniaArubaAustraliaAustriaAzerbaijanBahamas, TheBahrainBangladeshBarbadosBelarusBelgiumBelizeBeninBermudaBhutanBoliviaBosnia and HerzegovinaBotswanaBrazilBritish Virgin IslandsBrunei DarussalamBulgariaBurkina FasoBurundiCabo VerdeCambodiaCameroonCanadaCaribbean small statesCentral African RepublicCentral Europe and the BalticsChadChileChinaColombiaComorosCongo, Dem. Rep.Congo, Rep.Costa RicaCote d'IvoireCroatiaCubaCuracaoCyprusCzech RepublicDenmarkDjiboutiDominicaDominican RepublicEarly-demographic dividendEast Asia & PacificEast Asia & Pacific (excluding high income)East Asia & Pacific (IDA & IBRD countries)EcuadorEgypt, Arab Rep.El SalvadorEquatorial GuineaEritreaEstoniaEthiopiaEuro areaEurope & Central AsiaEurope & Central Asia (excluding high income)Europe & Central Asia (IDA & IBRD countries)European UnionFijiFinlandFragile and conflict affected situationsFranceGabonGambia, TheGeorgiaGermanyGhanaGreeceGrenadaGuatemalaGuineaGuinea-BissauGuyanaHaitiHeavily indebted poor countries (HIPC)High incomeHondurasHong Kong SAR, ChinaHungaryIBRD onlyIcelandIDA & IBRD totalIDA blendIDA onlyIDA totalIndiaIndonesiaIran, Islamic Rep.IraqIrelandIsraelItalyJamaicaJapanJordanKazakhstanKenyaKiribatiKorea, Dem. People’s Rep.Korea, Rep.KuwaitKyrgyz RepublicLao PDRLate-demographic dividendLatin America & Caribbean Latin America & Caribbean (excluding high income)Latin America & the Caribbean (IDA & IBRD countries)LatviaLeast developed countries: UN classificationLebanonLesothoLiberiaLibyaLiechtensteinLithuaniaLow & middle incomeLow incomeLower middle incomeLuxembourgMacao SAR, ChinaMacedonia, FYRMadagascarMalawiMalaysiaMaldivesMaliMaltaMarshall IslandsMauritaniaMauritiusMexicoMicronesia, Fed. Sts.Middle East & North AfricaMiddle East & North Africa (excluding high income)Middle East & North Africa (IDA & IBRD countries)Middle incomeMoldovaMongoliaMontenegroMoroccoMozambiqueMyanmarNamibiaNauruNepalNetherlandsNew ZealandNicaraguaNigerNigeriaNorth AmericaNorwayOECD membersOmanOther small statesPacific island small statesPakistanPalauPanamaPapua New GuineaParaguayPeruPhilippinesPolandPortugalPost-demographic dividendPre-demographic dividendPuerto RicoQatarRomaniaRussian FederationRwandaSamoaSan MarinoSao Tome and PrincipeSaudi ArabiaSenegalSerbiaSeychellesSierra LeoneSlovak RepublicSloveniaSmall statesSolomon IslandsSomaliaSouth AfricaSouth AsiaSouth Asia (IDA & IBRD)South SudanSpainSri LankaSt. Kitts and NevisSt. LuciaSt. Vincent and the GrenadinesSub-Saharan Africa Sub-Saharan Africa (excluding high income)Sub-Saharan Africa (IDA & IBRD countries)SudanSurinameSwazilandSwedenSwitzerlandSyrian Arab RepublicTajikistanTanzaniaThailandTimor-LesteTogoTongaTrinidad and TobagoTunisiaTurkeyTurkmenistanTuvaluUgandaUkraineUnited Arab EmiratesUnited KingdomUnited StatesUpper middle incomeUruguayUzbekistanVanuatuVenezuela, RBVietnamWest Bank and GazaWorldYemen, Rep.ZambiaZimbabwe Timeline:
This timeline shows a graph from 1972 to 2015 of United Kingdom. No data until 1971. Number of actual observations by date: 39.
Source name:
World Development Indicators
Source organization:
UNESCO Institute for Statistics
Categories, topics:
Education
Last updated:
apr 23, 2017
Indicators value changes by year
Minimum:
99.791
jan 1, 2003
Maximum:
108.741
jan 1, 2014
At the date of observation
Value
Absolute change
Change from previous value
jan 1, 1972
104.004
+104.004
0.0%
jan 1, 1973
103.351
-0.653
-0.63%
jan 1, 1974
102.601
-0.749
-0.73%
jan 1, 1975
102.672
+0.07
0.07%
jan 1, 1976
102.853
+0.182
0.18%
jan 1, 1977
103.303
+0.449
0.44%
jan 1, 1978
103.724
+0.421
0.41%
jan 1, 1979
103.856
+0.132
0.13%
jan 1, 1980
104.08
+0.224
0.22%
jan 1, 1981
104.271
+0.191
0.18%
jan 1, 1982
103.906
-0.365
-0.35%
jan 1, 1983
103.009
-0.896
-0.86%
jan 1, 1984
101.806
-1.203
-1.17%
jan 1, 1985
102.487
+0.681
0.67%
jan 1, 1986
102.744
+0.257
0.25%
jan 1, 1987
105.086
+2.342
2.28%
jan 1, 1988
106.748
+1.662
1.58%
jan 1, 1989
107.747
+0.999
0.94%
jan 1, 1990
107.424
-0.323
-0.3%
jan 1, 1991
106.853
-0.57
-0.53%
jan 1, 1992
105.499
-1.354
-1.27%
jan 1, 1993
104.188
-1.312
-1.24%
jan 1, 1999
100.81
-3.378
-3.24%
jan 1, 2000
100.694
-0.116
-0.12%
jan 1, 2001
100.386
-0.308
-0.31%
jan 1, 2002
100.239
-0.147
-0.15%
jan 1, 2003
99.791
-0.448
-0.45%
jan 1, 2004
99.908
+0.117
0.12%
jan 1, 2005
105.805
+5.897
5.9%
jan 1, 2006
106.271
+0.466
0.44%
jan 1, 2007
105.049
-1.222
-1.15%
jan 1, 2008
103.174
-1.875
-1.78%
jan 1, 2009
105.262
+2.088
2.02%
jan 1, 2010
104.961
-0.301
-0.29%
jan 1, 2011
105.861
+0.9
0.86%
jan 1, 2012
106.258
+0.397
0.37%
jan 1, 2013
108.243
+1.986
1.87%
jan 1, 2014
108.741
+0.498
0.46%
jan 1, 2015
108.24
-0.501
-0.46%
Ranking of countries by current statistics by years


Comments: