29
/
en
AIzaSyAYiBZKx7MnpbEhh9jyipgxe19OcubqV5w
April 1, 2024
171754
Kuwait
KWT
true
2
1
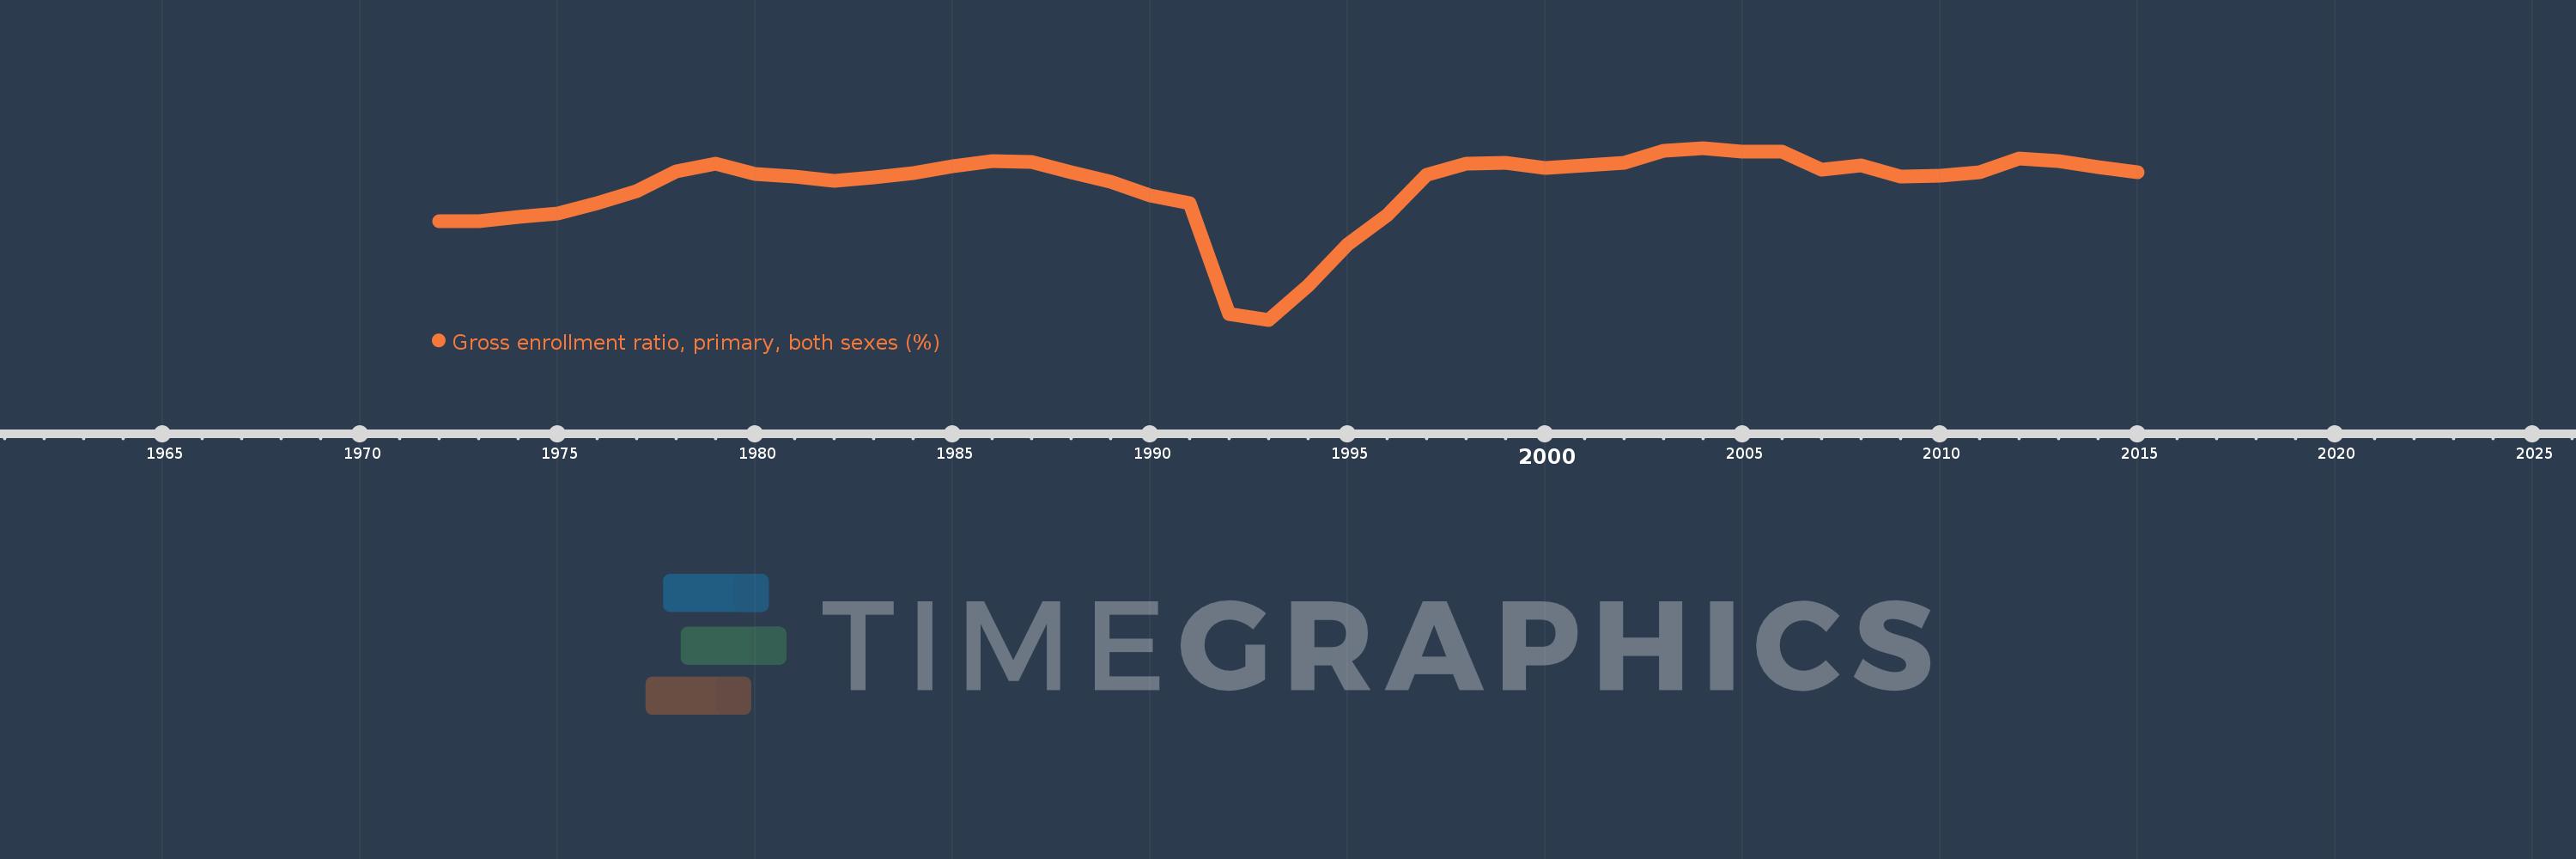
Gross enrollment ratio, primary, both sexes (%)
2015,2014,2013,2012,2011,2010,2009,2008,2007,2006,2005,2004,2003,2002,2001,2000,1999,1998,1997,1996,1995,1994,1993,1992,1991,1990,1989,1988,1987,1986,1985,1984,1983,1982,1981,1980,1979,1978,1977,1976,1975,1974,1973,1972
This statistics in other country:
AfghanistanAlbaniaAlgeriaAndorraAngolaAntigua and BarbudaArab WorldArgentinaArmeniaArubaAustraliaAustriaAzerbaijanBahamas, TheBahrainBangladeshBarbadosBelarusBelgiumBelizeBeninBermudaBhutanBoliviaBosnia and HerzegovinaBotswanaBrazilBritish Virgin IslandsBrunei DarussalamBulgariaBurkina FasoBurundiCabo VerdeCambodiaCameroonCanadaCaribbean small statesCentral African RepublicCentral Europe and the BalticsChadChileChinaColombiaComorosCongo, Dem. Rep.Congo, Rep.Costa RicaCote d'IvoireCroatiaCubaCuracaoCyprusCzech RepublicDenmarkDjiboutiDominicaDominican RepublicEarly-demographic dividendEast Asia & PacificEast Asia & Pacific (excluding high income)East Asia & Pacific (IDA & IBRD countries)EcuadorEgypt, Arab Rep.El SalvadorEquatorial GuineaEritreaEstoniaEthiopiaEuro areaEurope & Central AsiaEurope & Central Asia (excluding high income)Europe & Central Asia (IDA & IBRD countries)European UnionFijiFinlandFragile and conflict affected situationsFranceGabonGambia, TheGeorgiaGermanyGhanaGreeceGrenadaGuatemalaGuineaGuinea-BissauGuyanaHaitiHeavily indebted poor countries (HIPC)High incomeHondurasHong Kong SAR, ChinaHungaryIBRD onlyIcelandIDA & IBRD totalIDA blendIDA onlyIDA totalIndiaIndonesiaIran, Islamic Rep.IraqIrelandIsraelItalyJamaicaJapanJordanKazakhstanKenyaKiribatiKorea, Dem. People’s Rep.Korea, Rep.KuwaitKyrgyz RepublicLao PDRLate-demographic dividendLatin America & Caribbean Latin America & Caribbean (excluding high income)Latin America & the Caribbean (IDA & IBRD countries)LatviaLeast developed countries: UN classificationLebanonLesothoLiberiaLibyaLiechtensteinLithuaniaLow & middle incomeLow incomeLower middle incomeLuxembourgMacao SAR, ChinaMacedonia, FYRMadagascarMalawiMalaysiaMaldivesMaliMaltaMarshall IslandsMauritaniaMauritiusMexicoMicronesia, Fed. Sts.Middle East & North AfricaMiddle East & North Africa (excluding high income)Middle East & North Africa (IDA & IBRD countries)Middle incomeMoldovaMongoliaMontenegroMoroccoMozambiqueMyanmarNamibiaNauruNepalNetherlandsNew ZealandNicaraguaNigerNigeriaNorth AmericaNorwayOECD membersOmanOther small statesPacific island small statesPakistanPalauPanamaPapua New GuineaParaguayPeruPhilippinesPolandPortugalPost-demographic dividendPre-demographic dividendPuerto RicoQatarRomaniaRussian FederationRwandaSamoaSan MarinoSao Tome and PrincipeSaudi ArabiaSenegalSerbiaSeychellesSierra LeoneSlovak RepublicSloveniaSmall statesSolomon IslandsSomaliaSouth AfricaSouth AsiaSouth Asia (IDA & IBRD)South SudanSpainSri LankaSt. Kitts and NevisSt. LuciaSt. Vincent and the GrenadinesSub-Saharan Africa Sub-Saharan Africa (excluding high income)Sub-Saharan Africa (IDA & IBRD countries)SudanSurinameSwazilandSwedenSwitzerlandSyrian Arab RepublicTajikistanTanzaniaThailandTimor-LesteTogoTongaTrinidad and TobagoTunisiaTurkeyTurkmenistanTuvaluUgandaUkraineUnited Arab EmiratesUnited KingdomUnited StatesUpper middle incomeUruguayUzbekistanVanuatuVenezuela, RBVietnamWest Bank and GazaWorldYemen, Rep.ZambiaZimbabwe Timeline:
This timeline shows a graph from 1972 to 2015 of Kuwait. No data until 1971. Number of actual observations by date: 44.
Source name:
World Development Indicators
Source organization:
UNESCO Institute for Statistics
Categories, topics:
Education
Last updated:
apr 23, 2017
Indicators value changes by year
Maximum:
109.915
jan 1, 2004
At the date of observation
Value
Absolute change
Change from previous value
jan 1, 1972
88.29
+88.29
0.0%
jan 1, 1973
88.083
-0.208
-0.24%
jan 1, 1974
89.465
+1.382
1.57%
jan 1, 1975
90.602
+1.137
1.27%
jan 1, 1976
93.515
+2.913
3.22%
jan 1, 1977
97.045
+3.53
3.77%
jan 1, 1978
103.046
+6.002
6.18%
jan 1, 1979
105.141
+2.095
2.03%
jan 1, 1980
102.081
-3.06
-2.91%
jan 1, 1981
101.441
-0.64
-0.63%
jan 1, 1982
100.239
-1.202
-1.19%
jan 1, 1983
101.088
+0.849
0.85%
jan 1, 1984
102.4
+1.312
1.3%
jan 1, 1985
104.408
+2.009
1.96%
jan 1, 1986
106.081
+1.672
1.6%
jan 1, 1987
105.645
-0.436
-0.41%
jan 1, 1988
102.793
-2.851
-2.7%
jan 1, 1989
99.832
-2.961
-2.88%
jan 1, 1990
95.847
-3.985
-3.99%
jan 1, 1991
93.452
-2.395
-2.5%
jan 1, 1992
60.593
-32.858
-35.16%
jan 1, 1993
58.97
-1.623
-2.68%
jan 1, 1994
69.208
+10.238
17.36%
jan 1, 1995
81.277
+12.069
17.44%
jan 1, 1996
89.96
+8.682
10.68%
jan 1, 1997
101.902
+11.942
13.27%
jan 1, 1998
105.216
+3.314
3.25%
jan 1, 1999
105.529
+0.313
0.3%
jan 1, 2000
104.054
-1.475
-1.4%
jan 1, 2001
104.841
+0.787
0.76%
jan 1, 2002
105.572
+0.731
0.7%
jan 1, 2003
108.978
+3.406
3.23%
jan 1, 2004
109.915
+0.937
0.86%
jan 1, 2005
108.941
-0.974
-0.89%
jan 1, 2006
108.707
-0.234
-0.21%
jan 1, 2007
103.578
-5.129
-4.72%
jan 1, 2008
104.839
+1.261
1.22%
jan 1, 2009
101.518
-3.321
-3.17%
jan 1, 2010
101.631
+0.113
0.11%
jan 1, 2011
102.802
+1.171
1.15%
jan 1, 2012
106.801
+3.999
3.89%
jan 1, 2013
105.989
-0.812
-0.76%
jan 1, 2014
104.19
-1.799
-1.7%
jan 1, 2015
102.684
-1.506
-1.45%
Ranking of countries by current statistics by years


Comments: