30
/
AIzaSyAYiBZKx7MnpbEhh9jyipgxe19OcubqV5w
April 1, 2024
239339
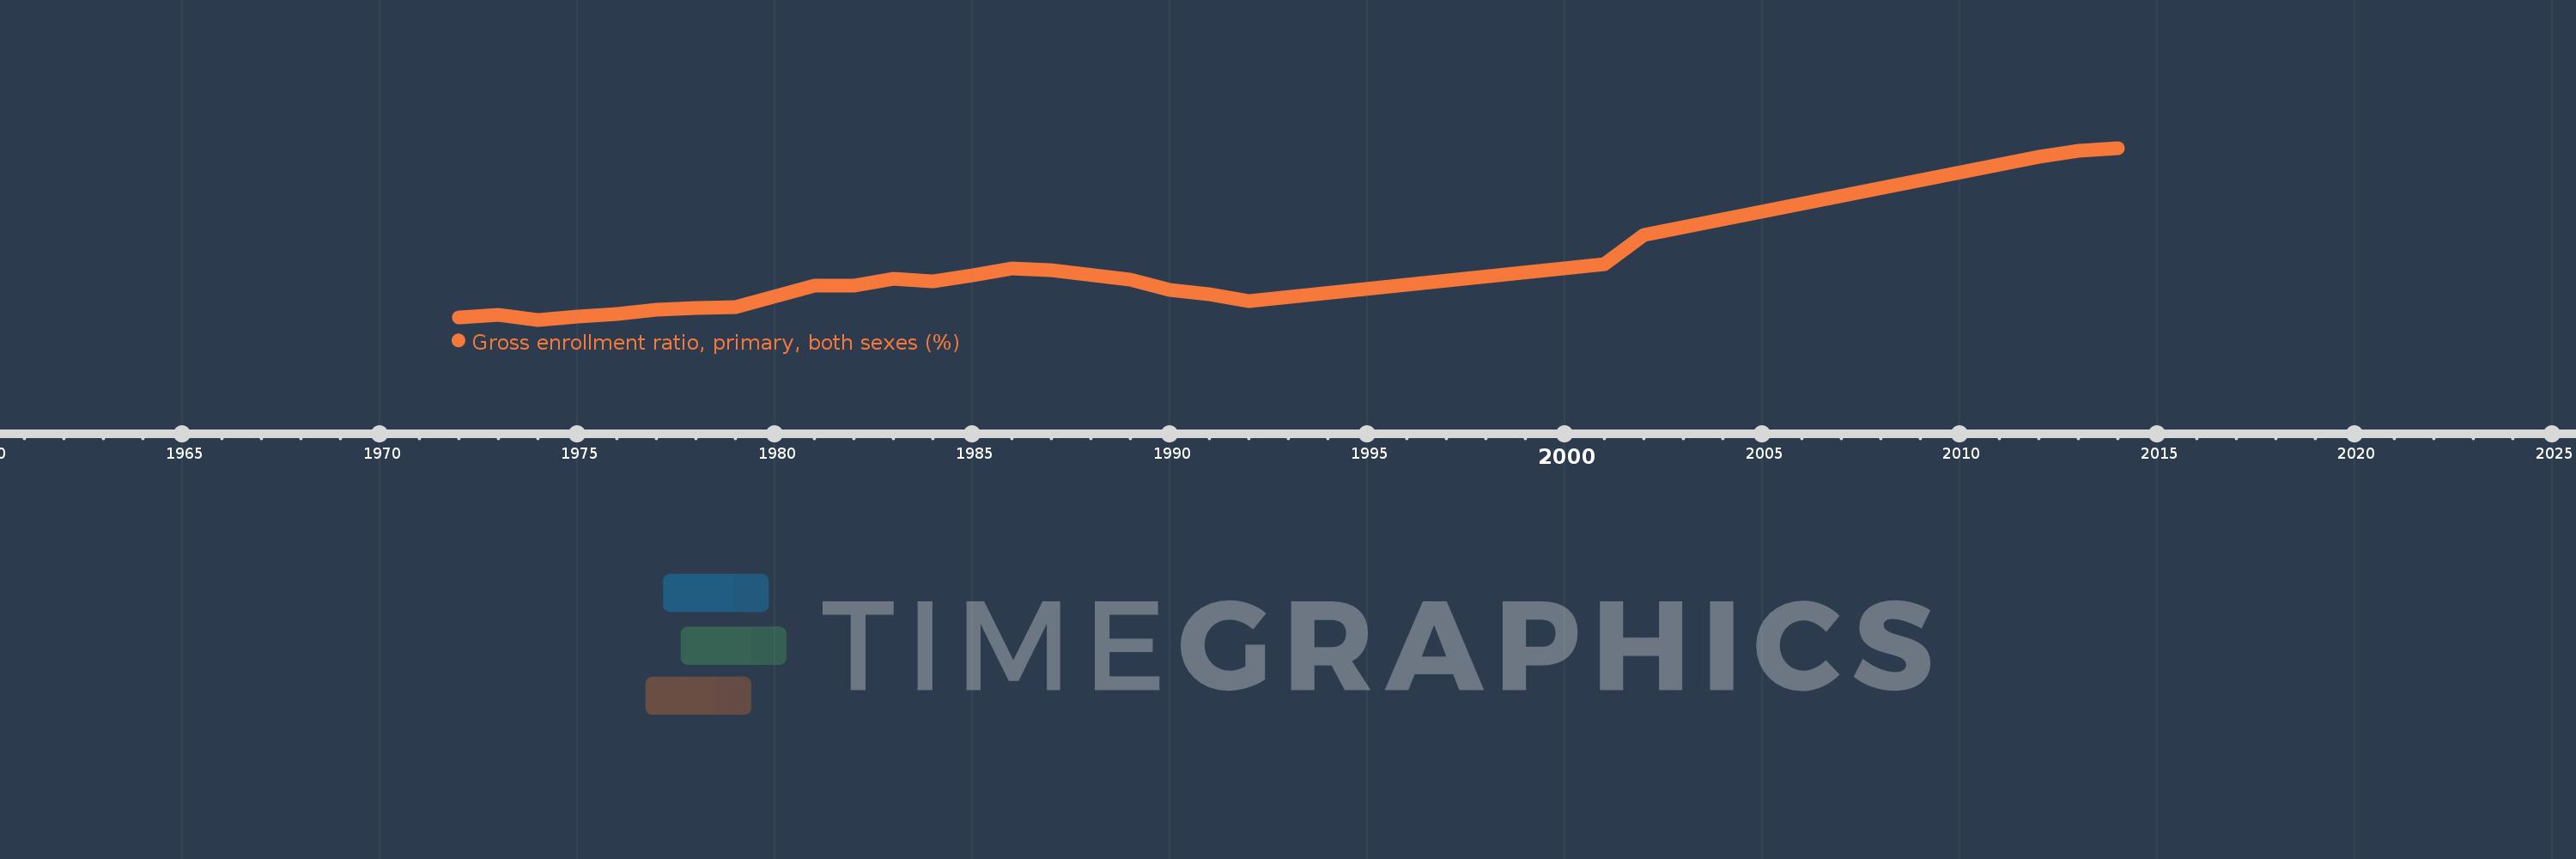
Sierra Leone
SLE
true
2
1
Gross enrollment ratio, primary, both sexes (%)
2014,2013,2012,2002,2001,1992,1991,1990,1989,1987,1986,1985,1984,1983,1982,1981,1979,1978,1977,1976,1975,1974,1973,1972
