29
/
en
AIzaSyAYiBZKx7MnpbEhh9jyipgxe19OcubqV5w
April 1, 2024
268036
Tunisia
TUN
true
2
1
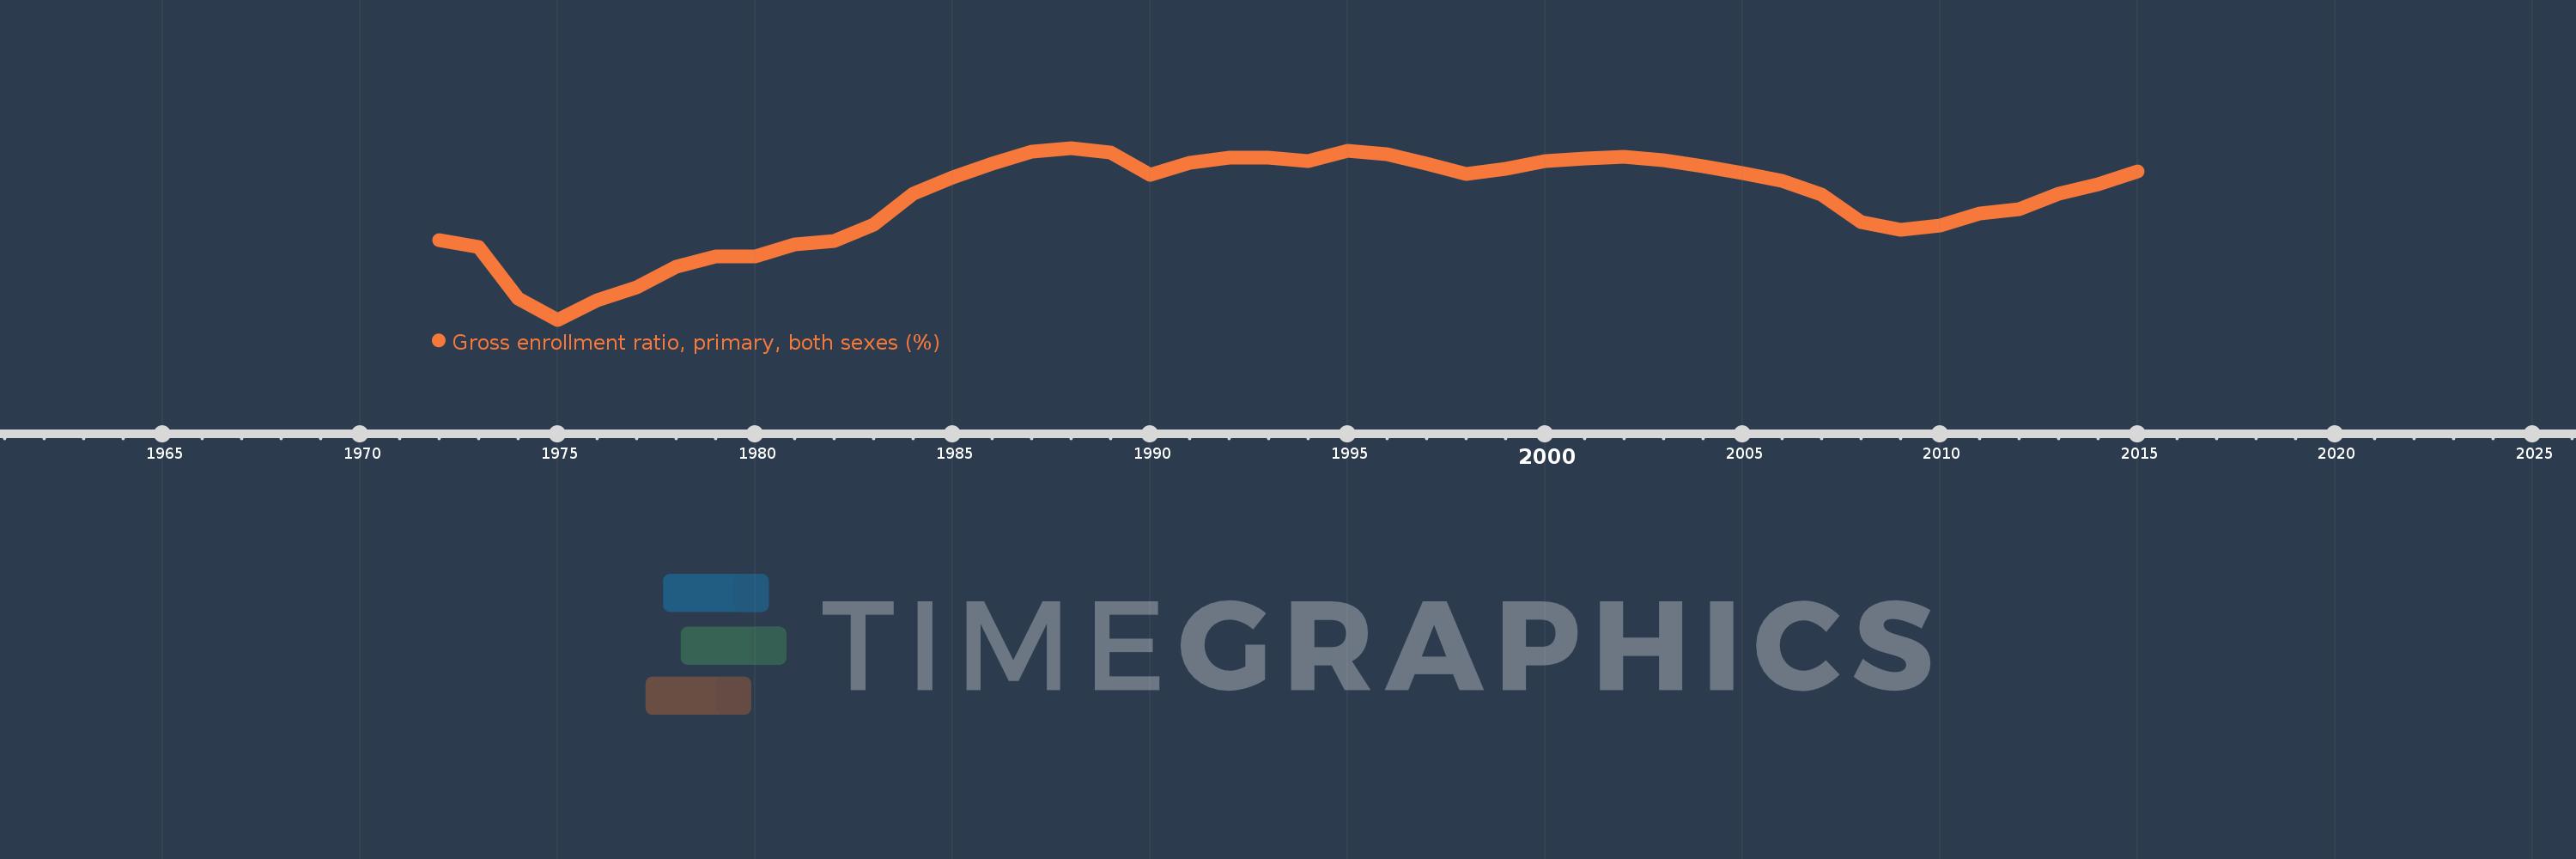
Gross enrollment ratio, primary, both sexes (%)
2015,2014,2013,2012,2011,2010,2009,2008,2007,2006,2005,2004,2003,2002,2001,2000,1999,1998,1997,1996,1995,1994,1993,1992,1991,1990,1989,1988,1987,1986,1985,1984,1983,1982,1981,1980,1979,1978,1977,1976,1975,1974,1973,1972
This statistics in other country:
AfghanistanAlbaniaAlgeriaAndorraAngolaAntigua and BarbudaArab WorldArgentinaArmeniaArubaAustraliaAustriaAzerbaijanBahamas, TheBahrainBangladeshBarbadosBelarusBelgiumBelizeBeninBermudaBhutanBoliviaBosnia and HerzegovinaBotswanaBrazilBritish Virgin IslandsBrunei DarussalamBulgariaBurkina FasoBurundiCabo VerdeCambodiaCameroonCanadaCaribbean small statesCentral African RepublicCentral Europe and the BalticsChadChileChinaColombiaComorosCongo, Dem. Rep.Congo, Rep.Costa RicaCote d'IvoireCroatiaCubaCuracaoCyprusCzech RepublicDenmarkDjiboutiDominicaDominican RepublicEarly-demographic dividendEast Asia & PacificEast Asia & Pacific (excluding high income)East Asia & Pacific (IDA & IBRD countries)EcuadorEgypt, Arab Rep.El SalvadorEquatorial GuineaEritreaEstoniaEthiopiaEuro areaEurope & Central AsiaEurope & Central Asia (excluding high income)Europe & Central Asia (IDA & IBRD countries)European UnionFijiFinlandFragile and conflict affected situationsFranceGabonGambia, TheGeorgiaGermanyGhanaGreeceGrenadaGuatemalaGuineaGuinea-BissauGuyanaHaitiHeavily indebted poor countries (HIPC)High incomeHondurasHong Kong SAR, ChinaHungaryIBRD onlyIcelandIDA & IBRD totalIDA blendIDA onlyIDA totalIndiaIndonesiaIran, Islamic Rep.IraqIrelandIsraelItalyJamaicaJapanJordanKazakhstanKenyaKiribatiKorea, Dem. People’s Rep.Korea, Rep.KuwaitKyrgyz RepublicLao PDRLate-demographic dividendLatin America & Caribbean Latin America & Caribbean (excluding high income)Latin America & the Caribbean (IDA & IBRD countries)LatviaLeast developed countries: UN classificationLebanonLesothoLiberiaLibyaLiechtensteinLithuaniaLow & middle incomeLow incomeLower middle incomeLuxembourgMacao SAR, ChinaMacedonia, FYRMadagascarMalawiMalaysiaMaldivesMaliMaltaMarshall IslandsMauritaniaMauritiusMexicoMicronesia, Fed. Sts.Middle East & North AfricaMiddle East & North Africa (excluding high income)Middle East & North Africa (IDA & IBRD countries)Middle incomeMoldovaMongoliaMontenegroMoroccoMozambiqueMyanmarNamibiaNauruNepalNetherlandsNew ZealandNicaraguaNigerNigeriaNorth AmericaNorwayOECD membersOmanOther small statesPacific island small statesPakistanPalauPanamaPapua New GuineaParaguayPeruPhilippinesPolandPortugalPost-demographic dividendPre-demographic dividendPuerto RicoQatarRomaniaRussian FederationRwandaSamoaSan MarinoSao Tome and PrincipeSaudi ArabiaSenegalSerbiaSeychellesSierra LeoneSlovak RepublicSloveniaSmall statesSolomon IslandsSomaliaSouth AfricaSouth AsiaSouth Asia (IDA & IBRD)South SudanSpainSri LankaSt. Kitts and NevisSt. LuciaSt. Vincent and the GrenadinesSub-Saharan Africa Sub-Saharan Africa (excluding high income)Sub-Saharan Africa (IDA & IBRD countries)SudanSurinameSwazilandSwedenSwitzerlandSyrian Arab RepublicTajikistanTanzaniaThailandTimor-LesteTogoTongaTrinidad and TobagoTunisiaTurkeyTurkmenistanTuvaluUgandaUkraineUnited Arab EmiratesUnited KingdomUnited StatesUpper middle incomeUruguayUzbekistanVanuatuVenezuela, RBVietnamWest Bank and GazaWorldYemen, Rep.ZambiaZimbabwe Timeline:
This timeline shows a graph from 1972 to 2015 of Tunisia. No data until 1971. Number of actual observations by date: 44.
Source name:
World Development Indicators
Source organization:
UNESCO Institute for Statistics
Categories, topics:
Education
Last updated:
apr 23, 2017
Indicators value changes by year
Minimum:
92.394
jan 1, 1975
Maximum:
116.288
jan 1, 1988
At the date of observation
Value
Absolute change
Change from previous value
jan 1, 1972
103.508
+103.508
0.0%
jan 1, 1973
102.455
-1.053
-1.02%
jan 1, 1974
95.365
-7.09
-6.92%
jan 1, 1975
92.394
-2.971
-3.12%
jan 1, 1976
95.064
+2.67
2.89%
jan 1, 1977
96.887
+1.823
1.92%
jan 1, 1978
99.766
+2.88
2.97%
jan 1, 1979
101.146
+1.379
1.38%
jan 1, 1980
101.189
+0.044
0.04%
jan 1, 1981
102.814
+1.625
1.61%
jan 1, 1982
103.4
+0.585
0.57%
jan 1, 1983
105.637
+2.237
2.16%
jan 1, 1984
109.867
+4.23
4.0%
jan 1, 1985
112.21
+2.343
2.13%
jan 1, 1986
114.066
+1.856
1.65%
jan 1, 1987
115.733
+1.667
1.46%
jan 1, 1988
116.288
+0.554
0.48%
jan 1, 1989
115.65
-0.637
-0.55%
jan 1, 1990
112.53
-3.12
-2.7%
jan 1, 1991
114.271
+1.74
1.55%
jan 1, 1992
114.974
+0.703
0.62%
jan 1, 1993
114.955
-0.019
-0.02%
jan 1, 1994
114.515
-0.441
-0.38%
jan 1, 1995
115.919
+1.404
1.23%
jan 1, 1996
115.402
-0.517
-0.45%
jan 1, 1997
114.094
-1.308
-1.13%
jan 1, 1998
112.623
-1.471
-1.29%
jan 1, 1999
113.356
+0.733
0.65%
jan 1, 2000
114.508
+1.152
1.02%
jan 1, 2001
114.869
+0.361
0.32%
jan 1, 2002
115.086
+0.217
0.19%
jan 1, 2003
114.524
-0.561
-0.49%
jan 1, 2004
113.77
-0.754
-0.66%
jan 1, 2005
112.731
-1.039
-0.91%
jan 1, 2006
111.745
-0.987
-0.88%
jan 1, 2007
109.775
-1.97
-1.76%
jan 1, 2008
105.961
-3.814
-3.47%
jan 1, 2009
104.912
-1.049
-0.99%
jan 1, 2010
105.483
+0.571
0.54%
jan 1, 2011
107.229
+1.746
1.66%
jan 1, 2012
107.72
+0.491
0.46%
jan 1, 2013
109.869
+2.149
1.99%
jan 1, 2014
111.282
+1.413
1.29%
jan 1, 2015
113.073
+1.792
1.61%
Ranking of countries by current statistics by years


Comments: