29
/
en
AIzaSyAYiBZKx7MnpbEhh9jyipgxe19OcubqV5w
April 1, 2024
53443
Other small states
OSS
false
2
1
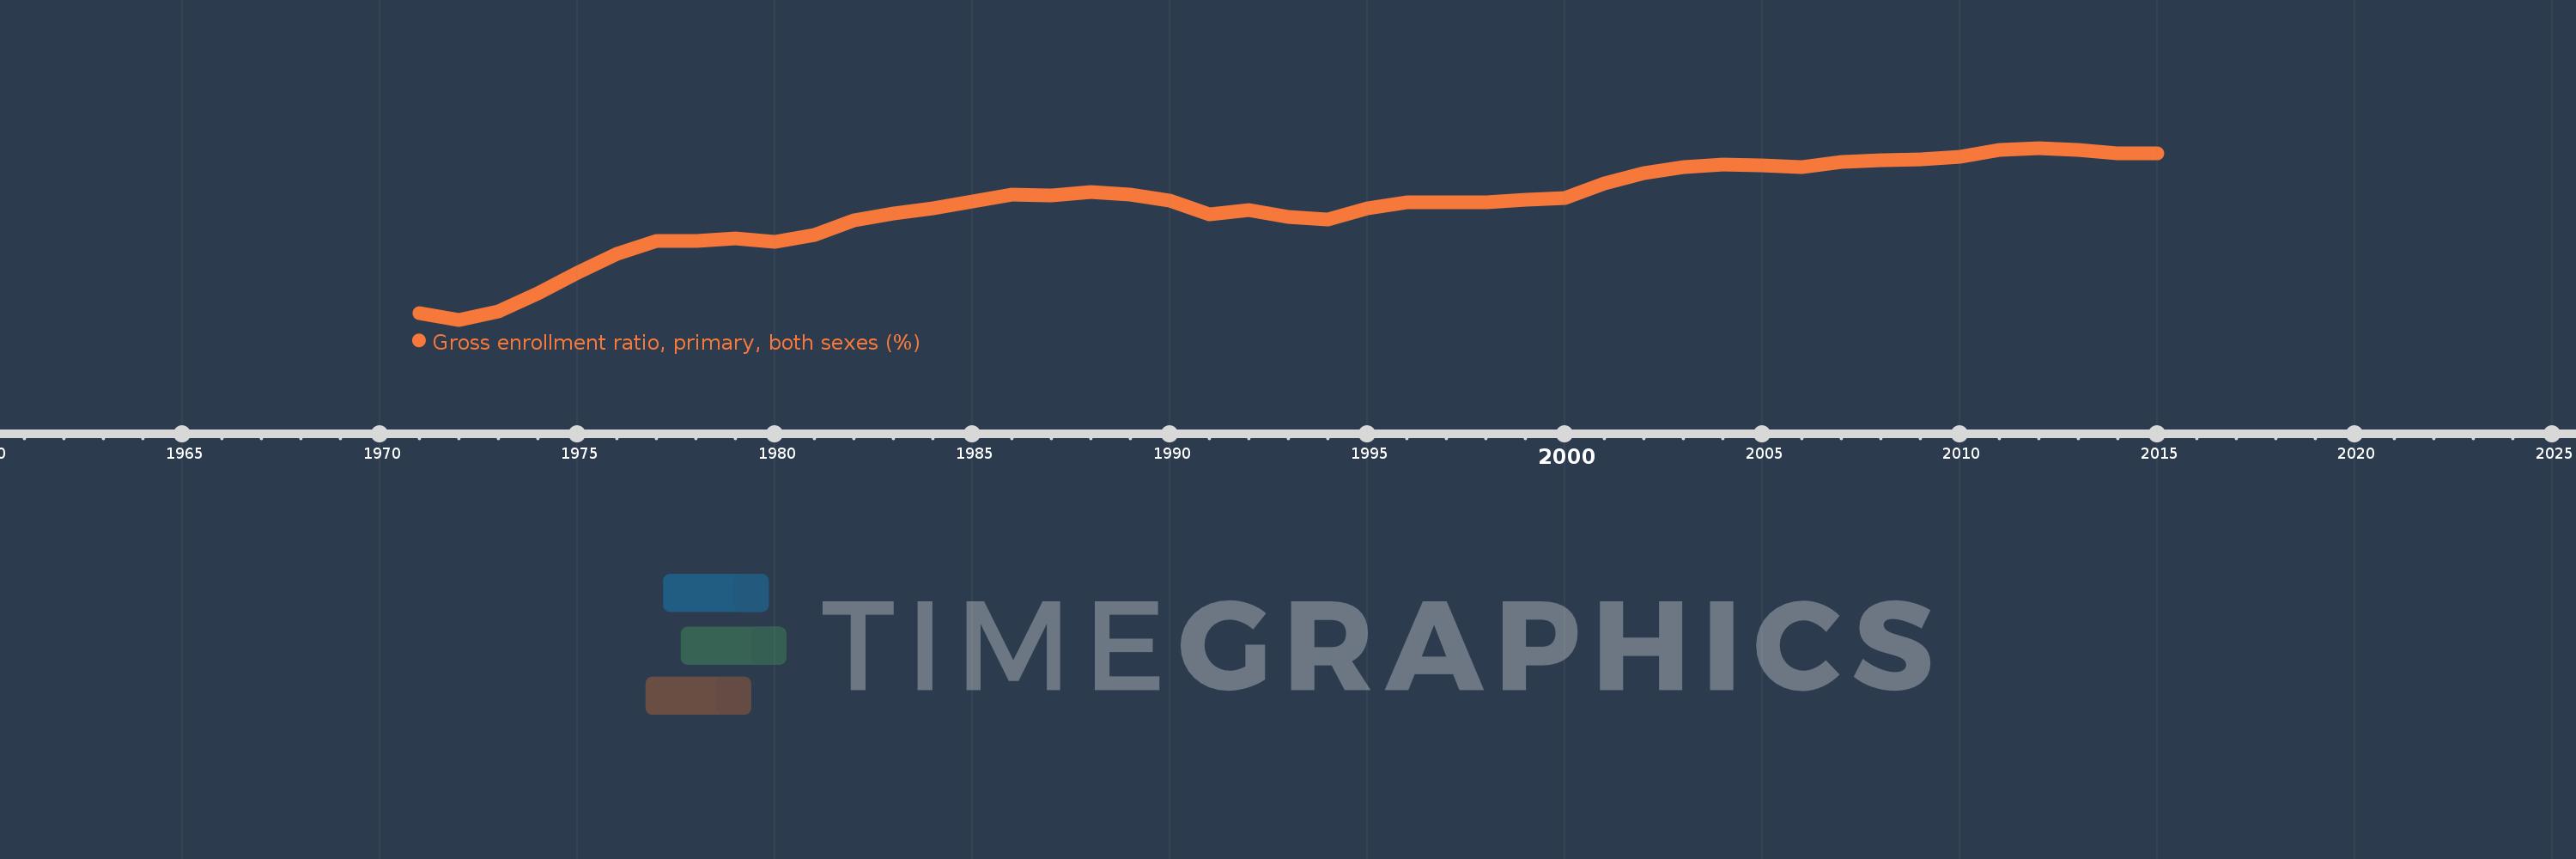
Gross enrollment ratio, primary, both sexes (%)
2015,2014,2013,2012,2011,2010,2009,2008,2007,2006,2005,2004,2003,2002,2001,2000,1999,1998,1997,1996,1995,1994,1993,1992,1991,1990,1989,1988,1987,1986,1985,1984,1983,1982,1981,1980,1979,1978,1977,1976,1975,1974,1973,1972,1971
This statistics in other country:
AfghanistanAlbaniaAlgeriaAndorraAngolaAntigua and BarbudaArab WorldArgentinaArmeniaArubaAustraliaAustriaAzerbaijanBahamas, TheBahrainBangladeshBarbadosBelarusBelgiumBelizeBeninBermudaBhutanBoliviaBosnia and HerzegovinaBotswanaBrazilBritish Virgin IslandsBrunei DarussalamBulgariaBurkina FasoBurundiCabo VerdeCambodiaCameroonCanadaCaribbean small statesCentral African RepublicCentral Europe and the BalticsChadChileChinaColombiaComorosCongo, Dem. Rep.Congo, Rep.Costa RicaCote d'IvoireCroatiaCubaCuracaoCyprusCzech RepublicDenmarkDjiboutiDominicaDominican RepublicEarly-demographic dividendEast Asia & PacificEast Asia & Pacific (excluding high income)East Asia & Pacific (IDA & IBRD countries)EcuadorEgypt, Arab Rep.El SalvadorEquatorial GuineaEritreaEstoniaEthiopiaEuro areaEurope & Central AsiaEurope & Central Asia (excluding high income)Europe & Central Asia (IDA & IBRD countries)European UnionFijiFinlandFragile and conflict affected situationsFranceGabonGambia, TheGeorgiaGermanyGhanaGreeceGrenadaGuatemalaGuineaGuinea-BissauGuyanaHaitiHeavily indebted poor countries (HIPC)High incomeHondurasHong Kong SAR, ChinaHungaryIBRD onlyIcelandIDA & IBRD totalIDA blendIDA onlyIDA totalIndiaIndonesiaIran, Islamic Rep.IraqIrelandIsraelItalyJamaicaJapanJordanKazakhstanKenyaKiribatiKorea, Dem. People’s Rep.Korea, Rep.KuwaitKyrgyz RepublicLao PDRLate-demographic dividendLatin America & Caribbean Latin America & Caribbean (excluding high income)Latin America & the Caribbean (IDA & IBRD countries)LatviaLeast developed countries: UN classificationLebanonLesothoLiberiaLibyaLiechtensteinLithuaniaLow & middle incomeLow incomeLower middle incomeLuxembourgMacao SAR, ChinaMacedonia, FYRMadagascarMalawiMalaysiaMaldivesMaliMaltaMarshall IslandsMauritaniaMauritiusMexicoMicronesia, Fed. Sts.Middle East & North AfricaMiddle East & North Africa (excluding high income)Middle East & North Africa (IDA & IBRD countries)Middle incomeMoldovaMongoliaMontenegroMoroccoMozambiqueMyanmarNamibiaNauruNepalNetherlandsNew ZealandNicaraguaNigerNigeriaNorth AmericaNorwayOECD membersOmanOther small statesPacific island small statesPakistanPalauPanamaPapua New GuineaParaguayPeruPhilippinesPolandPortugalPost-demographic dividendPre-demographic dividendPuerto RicoQatarRomaniaRussian FederationRwandaSamoaSan MarinoSao Tome and PrincipeSaudi ArabiaSenegalSerbiaSeychellesSierra LeoneSlovak RepublicSloveniaSmall statesSolomon IslandsSomaliaSouth AfricaSouth AsiaSouth Asia (IDA & IBRD)South SudanSpainSri LankaSt. Kitts and NevisSt. LuciaSt. Vincent and the GrenadinesSub-Saharan Africa Sub-Saharan Africa (excluding high income)Sub-Saharan Africa (IDA & IBRD countries)SudanSurinameSwazilandSwedenSwitzerlandSyrian Arab RepublicTajikistanTanzaniaThailandTimor-LesteTogoTongaTrinidad and TobagoTunisiaTurkeyTurkmenistanTuvaluUgandaUkraineUnited Arab EmiratesUnited KingdomUnited StatesUpper middle incomeUruguayUzbekistanVanuatuVenezuela, RBVietnamWest Bank and GazaWorldYemen, Rep.ZambiaZimbabwe Timeline:
This timeline shows a graph from 1971 to 2015 of Other small states. No data until 1970. Number of actual observations by date: 45.
Source name:
World Development Indicators
Source organization:
UNESCO Institute for Statistics
Categories, topics:
Education
Last updated:
apr 23, 2017
Indicators value changes by year
Minimum:
85.405
jan 1, 1972
Maximum:
107.424
jan 1, 2012
At the date of observation
Value
Absolute change
Change from previous value
jan 1, 1971
86.247
+86.247
0.0%
jan 1, 1972
85.405
-0.842
-0.98%
jan 1, 1973
86.52
+1.115
1.31%
jan 1, 1974
88.82
+2.3
2.66%
jan 1, 1975
91.455
+2.635
2.97%
jan 1, 1976
93.869
+2.414
2.64%
jan 1, 1977
95.447
+1.578
1.68%
jan 1, 1978
95.542
+0.095
0.1%
jan 1, 1979
95.869
+0.327
0.34%
jan 1, 1980
95.384
-0.486
-0.51%
jan 1, 1981
96.232
+0.848
0.89%
jan 1, 1982
98.105
+1.873
1.95%
jan 1, 1983
99.012
+0.908
0.93%
jan 1, 1984
99.737
+0.725
0.73%
jan 1, 1985
100.57
+0.832
0.83%
jan 1, 1986
101.406
+0.837
0.83%
jan 1, 1987
101.385
-0.021
-0.02%
jan 1, 1988
101.799
+0.414
0.41%
jan 1, 1989
101.449
-0.35
-0.34%
jan 1, 1990
100.644
-0.806
-0.79%
jan 1, 1991
98.962
-1.682
-1.67%
jan 1, 1992
99.51
+0.549
0.55%
jan 1, 1993
98.613
-0.898
-0.9%
jan 1, 1994
98.297
-0.315
-0.32%
jan 1, 1995
99.709
+1.412
1.44%
jan 1, 1996
100.487
+0.778
0.78%
jan 1, 1997
100.449
-0.038
-0.04%
jan 1, 1998
100.463
+0.014
0.01%
jan 1, 1999
100.824
+0.361
0.36%
jan 1, 2000
100.983
+0.159
0.16%
jan 1, 2001
102.83
+1.847
1.83%
jan 1, 2002
104.206
+1.376
1.34%
jan 1, 2003
104.928
+0.723
0.69%
jan 1, 2004
105.304
+0.375
0.36%
jan 1, 2005
105.224
-0.08
-0.08%
jan 1, 2006
104.969
-0.254
-0.24%
jan 1, 2007
105.653
+0.683
0.65%
jan 1, 2008
105.806
+0.153
0.15%
jan 1, 2009
105.91
+0.104
0.1%
jan 1, 2010
106.271
+0.361
0.34%
jan 1, 2011
107.209
+0.938
0.88%
jan 1, 2012
107.424
+0.214
0.2%
jan 1, 2013
107.127
-0.297
-0.28%
jan 1, 2014
106.762
-0.364
-0.34%
jan 1, 2015
106.755
-0.007
-0.01%
Ranking of countries by current statistics by years


Comments: