29
/
en
AIzaSyAYiBZKx7MnpbEhh9jyipgxe19OcubqV5w
April 1, 2024
262297
Thailand
THA
true
2
1
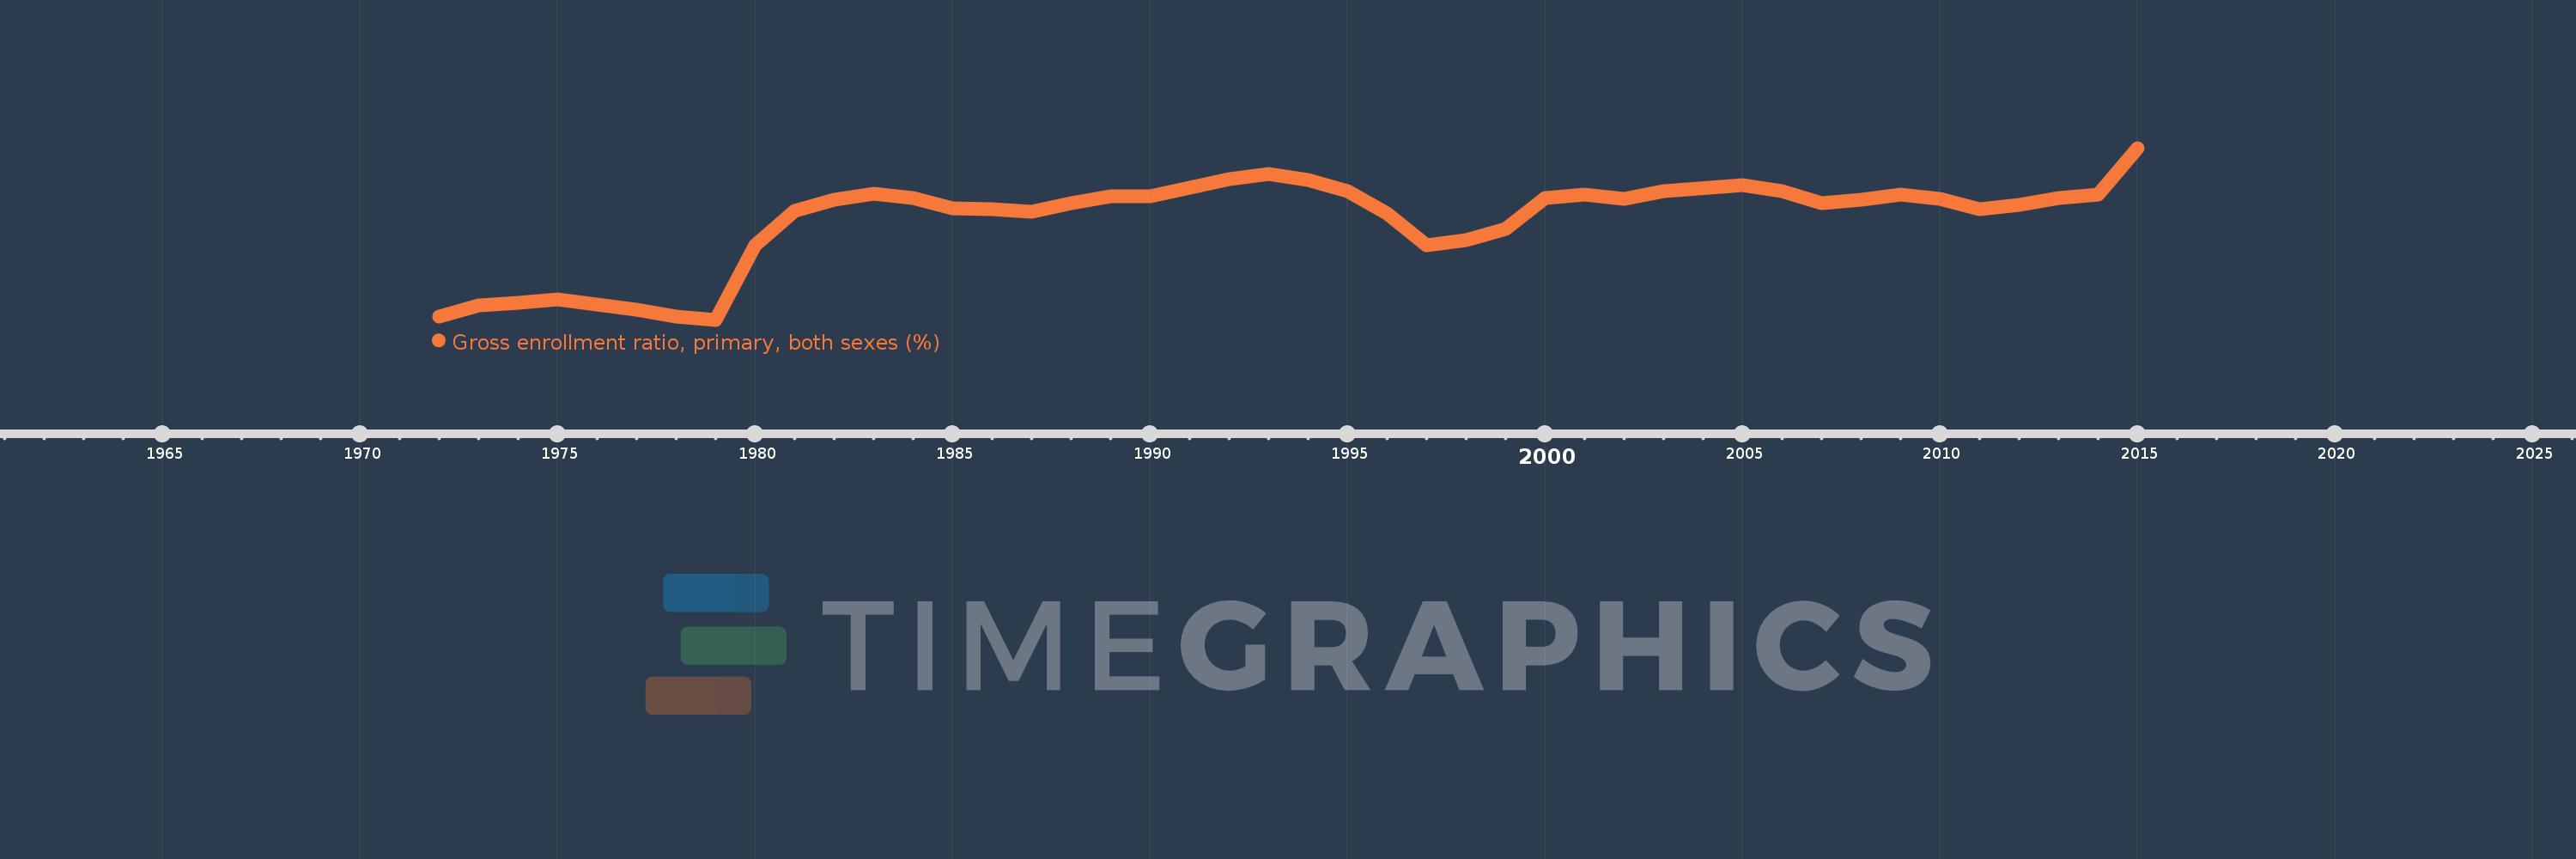
Gross enrollment ratio, primary, both sexes (%)
2015,2014,2013,2012,2011,2010,2009,2008,2007,2006,2005,2003,2002,2001,2000,1999,1998,1997,1996,1995,1994,1993,1992,1991,1990,1989,1988,1987,1986,1985,1984,1983,1982,1981,1980,1979,1978,1977,1976,1975,1974,1973,1972
This statistics in other country:
AfghanistanAlbaniaAlgeriaAndorraAngolaAntigua and BarbudaArab WorldArgentinaArmeniaArubaAustraliaAustriaAzerbaijanBahamas, TheBahrainBangladeshBarbadosBelarusBelgiumBelizeBeninBermudaBhutanBoliviaBosnia and HerzegovinaBotswanaBrazilBritish Virgin IslandsBrunei DarussalamBulgariaBurkina FasoBurundiCabo VerdeCambodiaCameroonCanadaCaribbean small statesCentral African RepublicCentral Europe and the BalticsChadChileChinaColombiaComorosCongo, Dem. Rep.Congo, Rep.Costa RicaCote d'IvoireCroatiaCubaCuracaoCyprusCzech RepublicDenmarkDjiboutiDominicaDominican RepublicEarly-demographic dividendEast Asia & PacificEast Asia & Pacific (excluding high income)East Asia & Pacific (IDA & IBRD countries)EcuadorEgypt, Arab Rep.El SalvadorEquatorial GuineaEritreaEstoniaEthiopiaEuro areaEurope & Central AsiaEurope & Central Asia (excluding high income)Europe & Central Asia (IDA & IBRD countries)European UnionFijiFinlandFragile and conflict affected situationsFranceGabonGambia, TheGeorgiaGermanyGhanaGreeceGrenadaGuatemalaGuineaGuinea-BissauGuyanaHaitiHeavily indebted poor countries (HIPC)High incomeHondurasHong Kong SAR, ChinaHungaryIBRD onlyIcelandIDA & IBRD totalIDA blendIDA onlyIDA totalIndiaIndonesiaIran, Islamic Rep.IraqIrelandIsraelItalyJamaicaJapanJordanKazakhstanKenyaKiribatiKorea, Dem. People’s Rep.Korea, Rep.KuwaitKyrgyz RepublicLao PDRLate-demographic dividendLatin America & Caribbean Latin America & Caribbean (excluding high income)Latin America & the Caribbean (IDA & IBRD countries)LatviaLeast developed countries: UN classificationLebanonLesothoLiberiaLibyaLiechtensteinLithuaniaLow & middle incomeLow incomeLower middle incomeLuxembourgMacao SAR, ChinaMacedonia, FYRMadagascarMalawiMalaysiaMaldivesMaliMaltaMarshall IslandsMauritaniaMauritiusMexicoMicronesia, Fed. Sts.Middle East & North AfricaMiddle East & North Africa (excluding high income)Middle East & North Africa (IDA & IBRD countries)Middle incomeMoldovaMongoliaMontenegroMoroccoMozambiqueMyanmarNamibiaNauruNepalNetherlandsNew ZealandNicaraguaNigerNigeriaNorth AmericaNorwayOECD membersOmanOther small statesPacific island small statesPakistanPalauPanamaPapua New GuineaParaguayPeruPhilippinesPolandPortugalPost-demographic dividendPre-demographic dividendPuerto RicoQatarRomaniaRussian FederationRwandaSamoaSan MarinoSao Tome and PrincipeSaudi ArabiaSenegalSerbiaSeychellesSierra LeoneSlovak RepublicSloveniaSmall statesSolomon IslandsSomaliaSouth AfricaSouth AsiaSouth Asia (IDA & IBRD)South SudanSpainSri LankaSt. Kitts and NevisSt. LuciaSt. Vincent and the GrenadinesSub-Saharan Africa Sub-Saharan Africa (excluding high income)Sub-Saharan Africa (IDA & IBRD countries)SudanSurinameSwazilandSwedenSwitzerlandSyrian Arab RepublicTajikistanTanzaniaThailandTimor-LesteTogoTongaTrinidad and TobagoTunisiaTurkeyTurkmenistanTuvaluUgandaUkraineUnited Arab EmiratesUnited KingdomUnited StatesUpper middle incomeUruguayUzbekistanVanuatuVenezuela, RBVietnamWest Bank and GazaWorldYemen, Rep.ZambiaZimbabwe Timeline:
This timeline shows a graph from 1972 to 2015 of Thailand. No data until 1971. Number of actual observations by date: 43.
Source name:
World Development Indicators
Source organization:
UNESCO Institute for Statistics
Categories, topics:
Education
Last updated:
apr 23, 2017
Indicators value changes by year
Maximum:
103.689
jan 1, 2015
At the date of observation
Value
Absolute change
Change from previous value
jan 1, 1972
82.773
+82.773
0.0%
jan 1, 1973
84.117
+1.344
1.62%
jan 1, 1974
84.519
+0.402
0.48%
jan 1, 1975
84.896
+0.377
0.45%
jan 1, 1976
84.303
-0.593
-0.7%
jan 1, 1977
83.674
-0.629
-0.75%
jan 1, 1978
82.745
-0.928
-1.11%
jan 1, 1979
82.38
-0.366
-0.44%
jan 1, 1980
91.639
+9.259
11.24%
jan 1, 1981
95.826
+4.187
4.57%
jan 1, 1982
97.276
+1.45
1.51%
jan 1, 1983
97.97
+0.694
0.71%
jan 1, 1984
97.5
-0.47
-0.48%
jan 1, 1985
96.181
-1.319
-1.35%
jan 1, 1986
96.113
-0.068
-0.07%
jan 1, 1987
95.744
-0.369
-0.38%
jan 1, 1988
96.829
+1.085
1.13%
jan 1, 1989
97.732
+0.903
0.93%
jan 1, 1990
97.734
+0.002
0.0%
jan 1, 1991
98.771
+1.037
1.06%
jan 1, 1992
99.821
+1.05
1.06%
jan 1, 1993
100.415
+0.594
0.6%
jan 1, 1994
99.689
-0.726
-0.72%
jan 1, 1995
98.371
-1.318
-1.32%
jan 1, 1996
95.535
-2.836
-2.88%
jan 1, 1997
91.632
-3.903
-4.09%
jan 1, 1998
92.252
+0.619
0.68%
jan 1, 1999
93.682
+1.43
1.55%
jan 1, 2000
97.529
+3.848
4.11%
jan 1, 2001
97.915
+0.385
0.39%
jan 1, 2002
97.409
-0.505
-0.52%
jan 1, 2003
98.304
+0.895
0.92%
jan 1, 2005
99.065
+0.76
0.77%
jan 1, 2006
98.323
-0.741
-0.75%
jan 1, 2007
96.864
-1.46
-1.48%
jan 1, 2008
97.28
+0.416
0.43%
jan 1, 2009
97.858
+0.579
0.59%
jan 1, 2010
97.412
-0.447
-0.46%
jan 1, 2011
96.103
-1.309
-1.34%
jan 1, 2012
96.628
+0.525
0.55%
jan 1, 2013
97.478
+0.85
0.88%
jan 1, 2014
97.904
+0.426
0.44%
jan 1, 2015
103.689
+5.785
5.91%
Ranking of countries by current statistics by years


Comments: