29
/
en
AIzaSyAYiBZKx7MnpbEhh9jyipgxe19OcubqV5w
April 1, 2024
85289
Bermuda
BMU
true
2
1
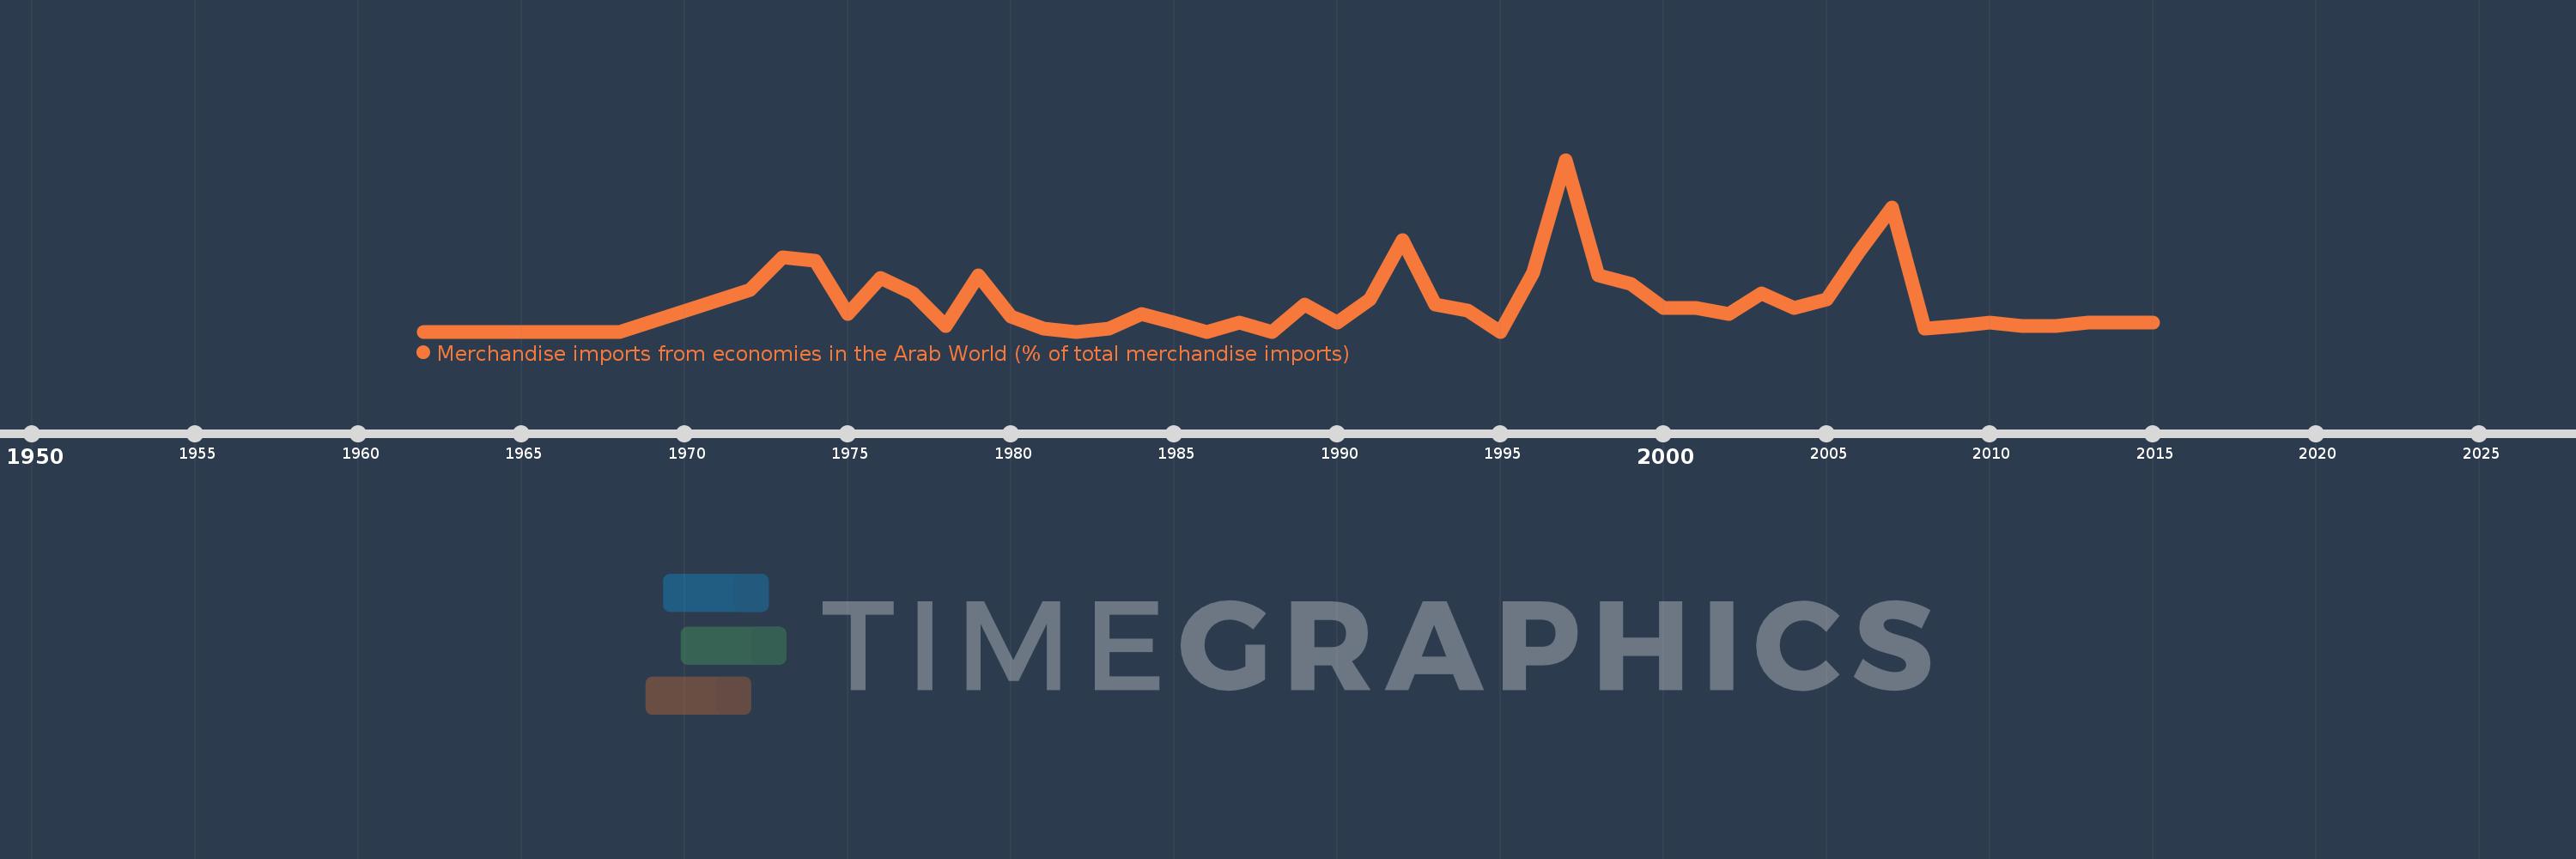
Merchandise imports from economies in the Arab World (% of total merchandise imports)
2015,2014,2013,2012,2011,2010,2009,2008,2007,2006,2005,2004,2003,2002,2001,2000,1999,1998,1997,1996,1995,1994,1993,1992,1991,1990,1989,1988,1987,1986,1985,1984,1983,1982,1981,1980,1979,1978,1977,1976,1975,1974,1973,1972,1968,1967,1966,1965,1964,1963,1962
This statistics in other country:
AfghanistanAlbaniaAlgeriaAngolaArab WorldArgentinaArmeniaArubaAustraliaAustriaAzerbaijanBahamas, TheBahrainBangladeshBarbadosBelarusBelgiumBelizeBeninBermudaBoliviaBrazilBrunei DarussalamBulgariaBurkina FasoBurundiCabo VerdeCambodiaCameroonCanadaCaribbean small statesCentral African RepublicCentral Europe and the BalticsChadChileChinaColombiaComorosCongo, Dem. Rep.Congo, Rep.Costa RicaCote d'IvoireCroatiaCubaCyprusCzech RepublicDenmarkDjiboutiDominicaDominican RepublicEarly-demographic dividendEast Asia & PacificEast Asia & Pacific (excluding high income)East Asia & Pacific (IDA & IBRD countries)EcuadorEgypt, Arab Rep.El SalvadorEstoniaEthiopiaEuro areaEurope & Central AsiaEurope & Central Asia (excluding high income)Europe & Central Asia (IDA & IBRD countries)European UnionFijiFinlandFragile and conflict affected situationsFranceFrench PolynesiaGabonGambia, TheGeorgiaGermanyGhanaGreeceGreenlandGrenadaGuatemalaGuineaGuinea-BissauGuyanaHaitiHeavily indebted poor countries (HIPC)High incomeHondurasHong Kong SAR, ChinaHungaryIBRD onlyIcelandIDA & IBRD totalIDA blendIDA onlyIDA totalIndiaIndonesiaIran, Islamic Rep.IraqIrelandItalyJamaicaJapanJordanKazakhstanKenyaKorea, Dem. People’s Rep.Korea, Rep.KuwaitKyrgyz RepublicLao PDRLate-demographic dividendLatin America & Caribbean Latin America & Caribbean (excluding high income)Latin America & the Caribbean (IDA & IBRD countries)LatviaLeast developed countries: UN classificationLebanonLiberiaLibyaLithuaniaLow & middle incomeLow incomeLower middle incomeLuxembourgMacao SAR, ChinaMacedonia, FYRMadagascarMalawiMalaysiaMaldivesMaliMaltaMauritaniaMauritiusMexicoMiddle East & North AfricaMiddle East & North Africa (excluding high income)Middle East & North Africa (IDA & IBRD countries)Middle incomeMoldovaMongoliaMontenegroMoroccoMozambiqueMyanmarNepalNetherlandsNew CaledoniaNew ZealandNicaraguaNigerNigeriaNorth AmericaNorwayOECD membersOmanOther small statesPacific island small statesPakistanPanamaPapua New GuineaParaguayPeruPhilippinesPolandPortugalPost-demographic dividendPre-demographic dividendQatarRomaniaRussian FederationRwandaSaudi ArabiaSenegalSerbiaSeychellesSierra LeoneSingaporeSlovak RepublicSloveniaSmall statesSomaliaSouth AfricaSouth AsiaSouth Asia (IDA & IBRD)SpainSri LankaSt. LuciaSt. Vincent and the GrenadinesSub-Saharan Africa Sub-Saharan Africa (excluding high income)Sub-Saharan Africa (IDA & IBRD countries)SudanSurinameSwedenSwitzerlandSyrian Arab RepublicTajikistanTanzaniaThailandTogoTrinidad and TobagoTunisiaTurkeyTurkmenistanUgandaUkraineUnited Arab EmiratesUnited KingdomUnited StatesUpper middle incomeUruguayVenezuela, RBVietnamWorldYemen, Rep.ZambiaZimbabwe Timeline:
This timeline shows a graph from 1962 to 2015 of Bermuda. No data until 1961. Number of actual observations by date: 51.
Source name:
World Development Indicators
Source organization:
World Bank staff estimates based data from International Monetary Fund's Direction of Trade database.
Categories, topics:
Private Sector, Trade
Last updated:
apr 23, 2017
Indicators value changes by year
At the date of observation
Value
Absolute change
Change from previous value
jan 1, 1972
0.014
+0.014
%
jan 1, 1973
0.025
+0.011
74.95%
jan 1, 1974
0.024
-0.001
-2.1%
jan 1, 1975
0.006
-0.019
-75.91%
jan 1, 1976
0.018
+0.013
214.27%
jan 1, 1977
0.013
-0.005
-28.61%
jan 1, 1978
0.002
-0.011
-81.43%
jan 1, 1979
0.019
+0.016
671.89%
jan 1, 1980
0.005
-0.013
-71.24%
jan 1, 1981
0.001
-0.005
-89.27%
jan 1, 1982
0.0
0.0
-51.74%
jan 1, 1983
0.001
+0.0
83.66%
jan 1, 1984
0.006
+0.006
1.06K%
jan 1, 1985
0.003
-0.003
-48.92%
jan 1, 1986
0.0
-0.003
-100.0%
jan 1, 1987
0.003
+0.003
%
jan 1, 1988
0.0
-0.003
-100.0%
jan 1, 1989
0.009
+0.009
%
jan 1, 1990
0.003
-0.005
-63.02%
jan 1, 1991
0.011
+0.008
248.98%
jan 1, 1992
0.031
+0.02
176.52%
jan 1, 1993
0.009
-0.021
-69.4%
jan 1, 1994
0.007
-0.002
-23.14%
jan 1, 1995
0.0
-0.007
-98.33%
jan 1, 1996
0.02
+0.02
16.76K%
jan 1, 1997
0.058
+0.038
185.83%
jan 1, 1998
0.019
-0.039
-66.93%
jan 1, 1999
0.016
-0.003
-16.88%
jan 1, 2000
0.008
-0.008
-47.33%
jan 1, 2001
0.008
0.0
-0.55%
jan 1, 2002
0.006
-0.003
-31.32%
jan 1, 2003
0.013
+0.007
120.77%
jan 1, 2004
0.008
-0.005
-37.59%
jan 1, 2005
0.011
+0.003
37.44%
jan 1, 2006
0.027
+0.016
144.18%
jan 1, 2007
0.042
+0.016
59.15%
jan 1, 2008
0.001
-0.041
-96.71%
jan 1, 2009
0.002
+0.001
64.3%
jan 1, 2010
0.003
+0.001
51.65%
jan 1, 2011
0.002
-0.002
-49.7%
jan 1, 2012
0.002
+0.001
32.96%
jan 1, 2013
0.003
+0.001
35.05%
jan 1, 2014
0.003
+0.0
0.68%
jan 1, 2015
0.003
0.0
-11.67%
Ranking of countries by current statistics by years


Comments: