29
/
en
AIzaSyAYiBZKx7MnpbEhh9jyipgxe19OcubqV5w
April 1, 2024
264877
Togo
TGO
true
2
1
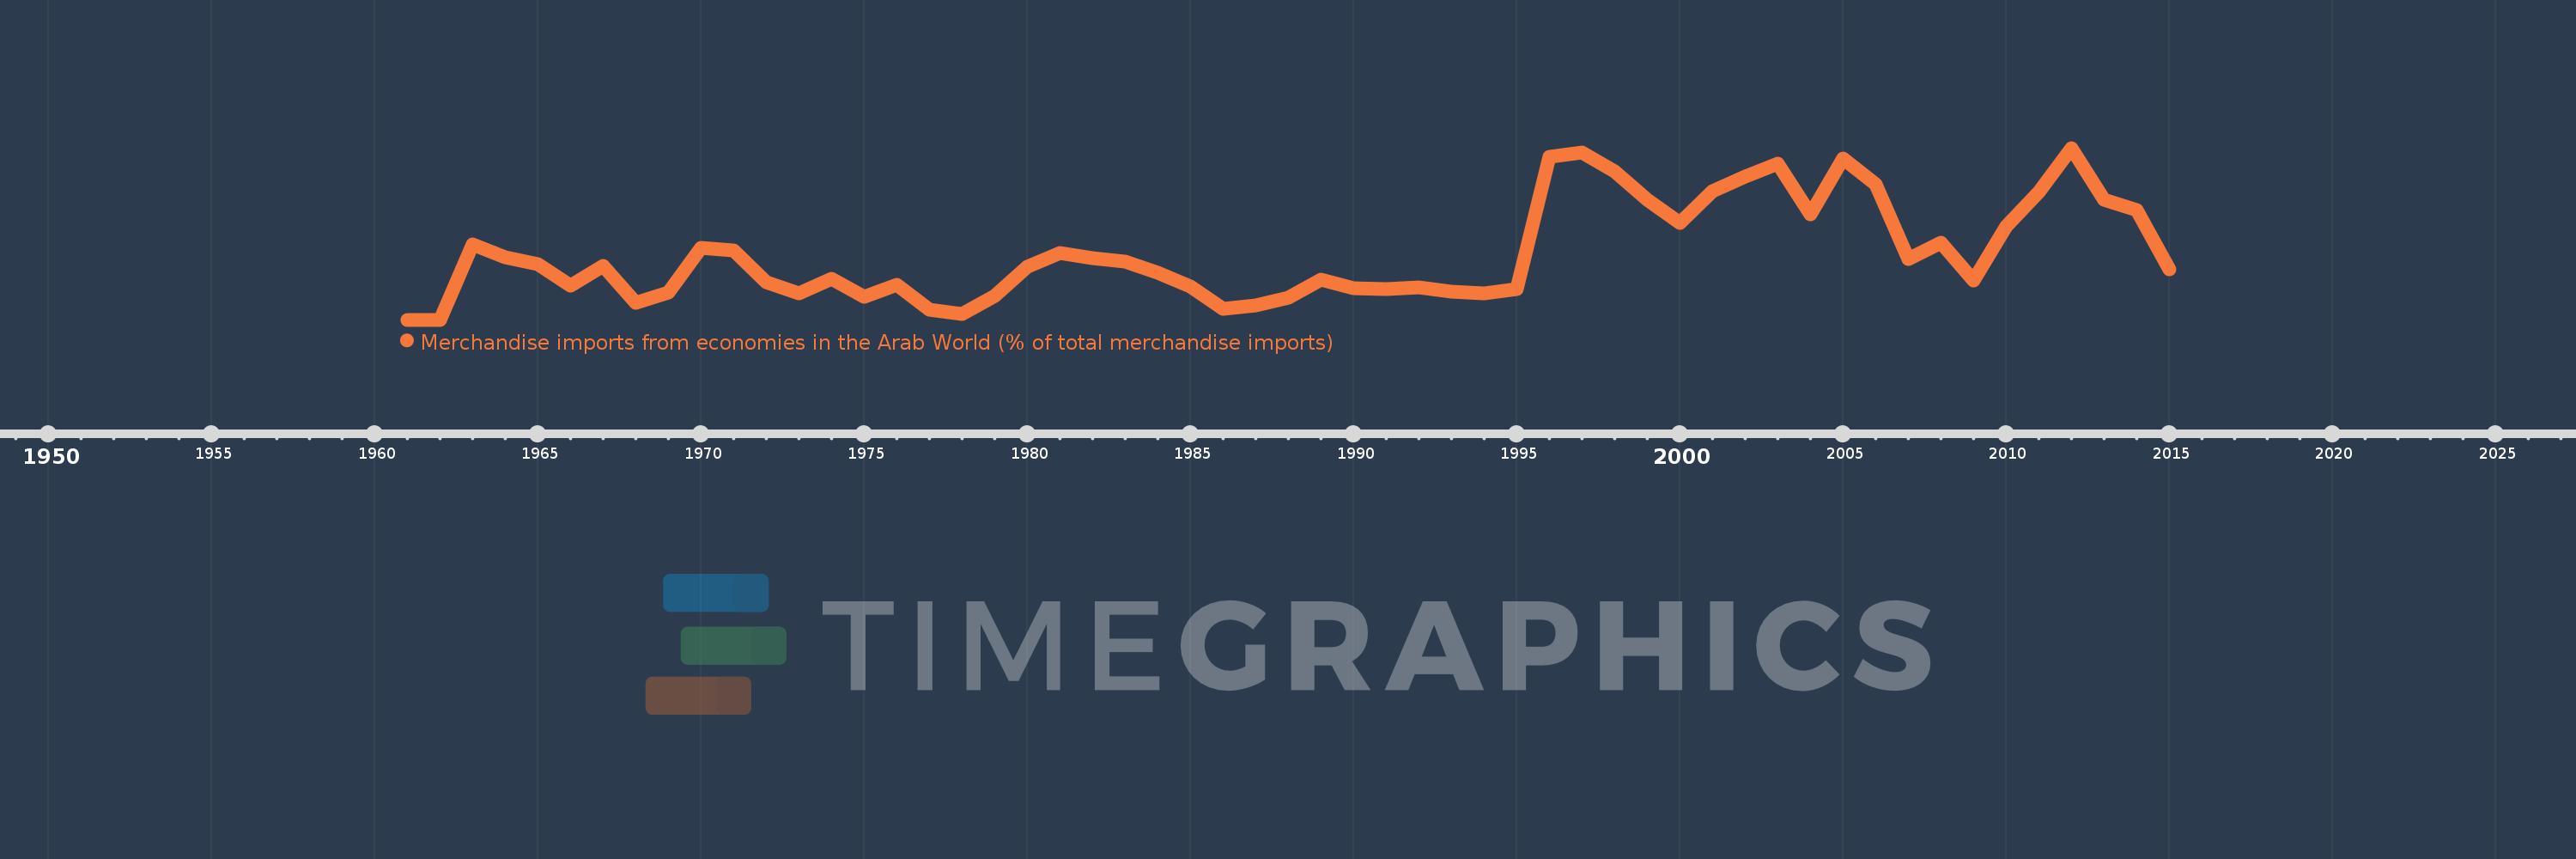
Merchandise imports from economies in the Arab World (% of total merchandise imports)
2015,2014,2013,2012,2011,2010,2009,2008,2007,2006,2005,2004,2003,2002,2001,2000,1999,1998,1997,1996,1995,1994,1993,1992,1991,1990,1989,1988,1987,1986,1985,1984,1983,1982,1981,1980,1979,1978,1977,1976,1975,1974,1973,1972,1971,1970,1969,1968,1967,1966,1965,1964,1963,1962,1961
This statistics in other country:
AfghanistanAlbaniaAlgeriaAngolaArab WorldArgentinaArmeniaArubaAustraliaAustriaAzerbaijanBahamas, TheBahrainBangladeshBarbadosBelarusBelgiumBelizeBeninBermudaBoliviaBrazilBrunei DarussalamBulgariaBurkina FasoBurundiCabo VerdeCambodiaCameroonCanadaCaribbean small statesCentral African RepublicCentral Europe and the BalticsChadChileChinaColombiaComorosCongo, Dem. Rep.Congo, Rep.Costa RicaCote d'IvoireCroatiaCubaCyprusCzech RepublicDenmarkDjiboutiDominicaDominican RepublicEarly-demographic dividendEast Asia & PacificEast Asia & Pacific (excluding high income)East Asia & Pacific (IDA & IBRD countries)EcuadorEgypt, Arab Rep.El SalvadorEstoniaEthiopiaEuro areaEurope & Central AsiaEurope & Central Asia (excluding high income)Europe & Central Asia (IDA & IBRD countries)European UnionFijiFinlandFragile and conflict affected situationsFranceFrench PolynesiaGabonGambia, TheGeorgiaGermanyGhanaGreeceGreenlandGrenadaGuatemalaGuineaGuinea-BissauGuyanaHaitiHeavily indebted poor countries (HIPC)High incomeHondurasHong Kong SAR, ChinaHungaryIBRD onlyIcelandIDA & IBRD totalIDA blendIDA onlyIDA totalIndiaIndonesiaIran, Islamic Rep.IraqIrelandItalyJamaicaJapanJordanKazakhstanKenyaKorea, Dem. People’s Rep.Korea, Rep.KuwaitKyrgyz RepublicLao PDRLate-demographic dividendLatin America & Caribbean Latin America & Caribbean (excluding high income)Latin America & the Caribbean (IDA & IBRD countries)LatviaLeast developed countries: UN classificationLebanonLiberiaLibyaLithuaniaLow & middle incomeLow incomeLower middle incomeLuxembourgMacao SAR, ChinaMacedonia, FYRMadagascarMalawiMalaysiaMaldivesMaliMaltaMauritaniaMauritiusMexicoMiddle East & North AfricaMiddle East & North Africa (excluding high income)Middle East & North Africa (IDA & IBRD countries)Middle incomeMoldovaMongoliaMontenegroMoroccoMozambiqueMyanmarNepalNetherlandsNew CaledoniaNew ZealandNicaraguaNigerNigeriaNorth AmericaNorwayOECD membersOmanOther small statesPacific island small statesPakistanPanamaPapua New GuineaParaguayPeruPhilippinesPolandPortugalPost-demographic dividendPre-demographic dividendQatarRomaniaRussian FederationRwandaSaudi ArabiaSenegalSerbiaSeychellesSierra LeoneSingaporeSlovak RepublicSloveniaSmall statesSomaliaSouth AfricaSouth AsiaSouth Asia (IDA & IBRD)SpainSri LankaSt. LuciaSt. Vincent and the GrenadinesSub-Saharan Africa Sub-Saharan Africa (excluding high income)Sub-Saharan Africa (IDA & IBRD countries)SudanSurinameSwedenSwitzerlandSyrian Arab RepublicTajikistanTanzaniaThailandTogoTrinidad and TobagoTunisiaTurkeyTurkmenistanUgandaUkraineUnited Arab EmiratesUnited KingdomUnited StatesUpper middle incomeUruguayVenezuela, RBVietnamWorldYemen, Rep.ZambiaZimbabwe Timeline:
This timeline shows a graph from 1961 to 2015 of Togo. No data until 1960. Number of actual observations by date: 55.
Source name:
World Development Indicators
Source organization:
World Bank staff estimates based data from International Monetary Fund's Direction of Trade database.
Categories, topics:
Private Sector, Trade
Last updated:
apr 23, 2017
Indicators value changes by year
At the date of observation
Value
Absolute change
Change from previous value
jan 1, 1963
2.952
+2.952
%
jan 1, 1964
2.439
-0.513
-17.38%
jan 1, 1965
2.179
-0.26
-10.65%
jan 1, 1966
1.336
-0.843
-38.68%
jan 1, 1967
2.123
+0.787
58.88%
jan 1, 1968
0.668
-1.455
-68.53%
jan 1, 1969
1.082
+0.414
61.98%
jan 1, 1970
2.814
+1.731
159.98%
jan 1, 1971
2.713
-0.1
-3.56%
jan 1, 1972
1.464
-1.249
-46.04%
jan 1, 1973
1.043
-0.422
-28.8%
jan 1, 1974
1.597
+0.554
53.14%
jan 1, 1975
0.893
-0.704
-44.08%
jan 1, 1976
1.358
+0.465
52.08%
jan 1, 1977
0.402
-0.956
-70.39%
jan 1, 1978
0.209
-0.193
-48.01%
jan 1, 1979
0.928
+0.719
344.15%
jan 1, 1980
2.083
+1.155
124.43%
jan 1, 1981
2.601
+0.518
24.86%
jan 1, 1982
2.422
-0.179
-6.87%
jan 1, 1983
2.277
-0.145
-5.99%
jan 1, 1984
1.829
-0.448
-19.66%
jan 1, 1985
1.3
-0.53
-28.95%
jan 1, 1986
0.427
-0.873
-67.18%
jan 1, 1987
0.574
+0.148
34.61%
jan 1, 1988
0.861
+0.286
49.87%
jan 1, 1989
1.572
+0.712
82.69%
jan 1, 1990
1.245
-0.327
-20.79%
jan 1, 1991
1.202
-0.043
-3.46%
jan 1, 1992
1.26
+0.058
4.83%
jan 1, 1993
1.098
-0.162
-12.87%
jan 1, 1994
1.021
-0.077
-7.0%
jan 1, 1995
1.188
+0.167
16.39%
jan 1, 1996
6.401
+5.213
438.64%
jan 1, 1997
6.539
+0.137
2.15%
jan 1, 1998
5.803
-0.735
-11.25%
jan 1, 1999
4.713
-1.09
-18.79%
jan 1, 2000
3.788
-0.925
-19.63%
jan 1, 2001
5.032
+1.245
32.86%
jan 1, 2002
5.614
+0.582
11.56%
jan 1, 2003
6.117
+0.503
8.96%
jan 1, 2004
4.12
-1.996
-32.64%
jan 1, 2005
6.317
+2.197
53.31%
jan 1, 2006
5.298
-1.019
-16.13%
jan 1, 2007
2.39
-2.909
-54.9%
jan 1, 2008
3.033
+0.643
26.91%
jan 1, 2009
1.527
-1.506
-49.65%
jan 1, 2010
3.653
+2.126
139.2%
jan 1, 2011
5.011
+1.358
37.19%
jan 1, 2012
6.734
+1.723
34.39%
jan 1, 2013
4.705
-2.029
-30.13%
jan 1, 2014
4.298
-0.407
-8.65%
jan 1, 2015
1.977
-2.321
-54.0%
Ranking of countries by current statistics by years


Comments: